

The Arweave price prediction is for the AR/USDT pair to follow Solana’s lead, due to the correlated status of both tokens. With price action coming very close to strong support yet not too far from a potential resistance, traders need to be aware of the triggers that point to a further decline or a continuation of the uptrend.
Following the stellar performance of Arweave last week, where it nearly doubled in price, there has been a profit-taking-induced correction. This correction followed the breakdown of the symmetrical triangle on the 4-hour chart, with various Fibonacci retracement levels providing the boundaries for support and resistance.
Arweave got its impetus for a price surge from the tripartite deal signed by the Solana Network, Lightspeed Venture Partners and the FTX exchange. This deal brought together a $100m investment from the three companies to develop a video game development suite on Solana’s blockchain. The SOLAR bridge is the cross-chain bridge that stores Solana’s data on the Arweave blockchain securely. This, by extension, has provided a positive correlation between Solana and Arweave. With Solana hitting new all-time highs last week, Arweave followed suit.
Arweave Price Prediction
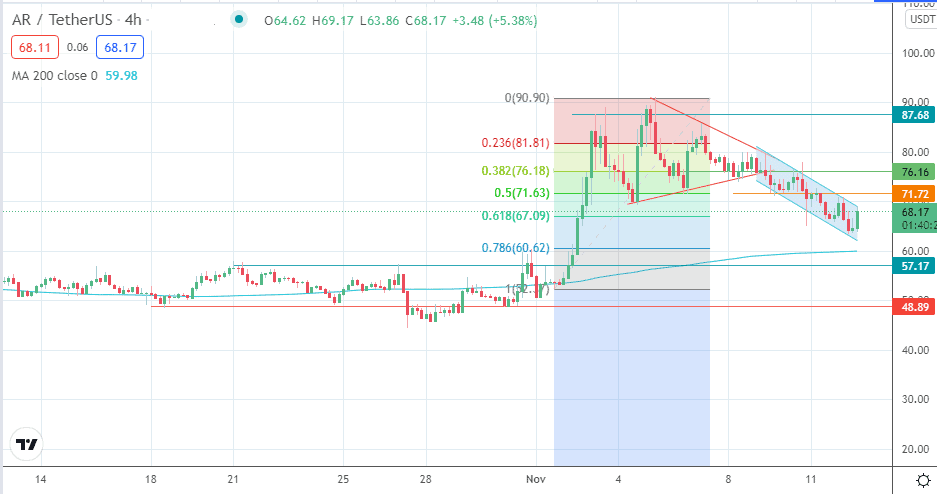
The 4-hour chart provides the basis for the Arweave price prediction. The deceleration from the symmetrical triangle continues the correction from the recent all-time highs. This breakdown move has occurred within the context of the descending channel. The active 4-hour candle has pivoted off the channel’s lower border and attained the channel’s trendline. If the price breaks above this trendline and the 71.72 resistance, then 76.16 (38.2% Fibonacci retracement level) becomes the new target to the upside. 80.00 and 87.68 are additional targets to the north.
On the flip side, a rejection at the channel’s trendline brings the return line’s potential interaction with the 200-day moving average around 60.00 under scrutiny. If the bears overcome this pivot, downside targets could be seen at 57.17 and 48.89 in sequence.
AR/USDT: 4-Hour Chart
Follow Eno on Twitter.
See also

This news is republished from another source. You can check the original article here
Be the first to comment