

Axie Infinity price prepares for a 27% ascent as bearish momentum weakens
Axie Infinity price appears ready for a 27% bounce toward $121 if it manages to slice above the resistance line of the governing chart pattern. However, AXS may face ample challenges ahead before the bullish target could be reached.
Axie Infinity price offers bullish outlook
Axie Infinity price has formed a falling wedge pattern on the 4-hour chart, suggesting an overall optimistic outlook. AXS must break above the upper boundary of the technical pattern at $95 in order for the 27% ascent target toward $121 given by the prevailing chart pattern to be achieved.
Shiba Inu price needs to form a base for SHIB to rally 25%
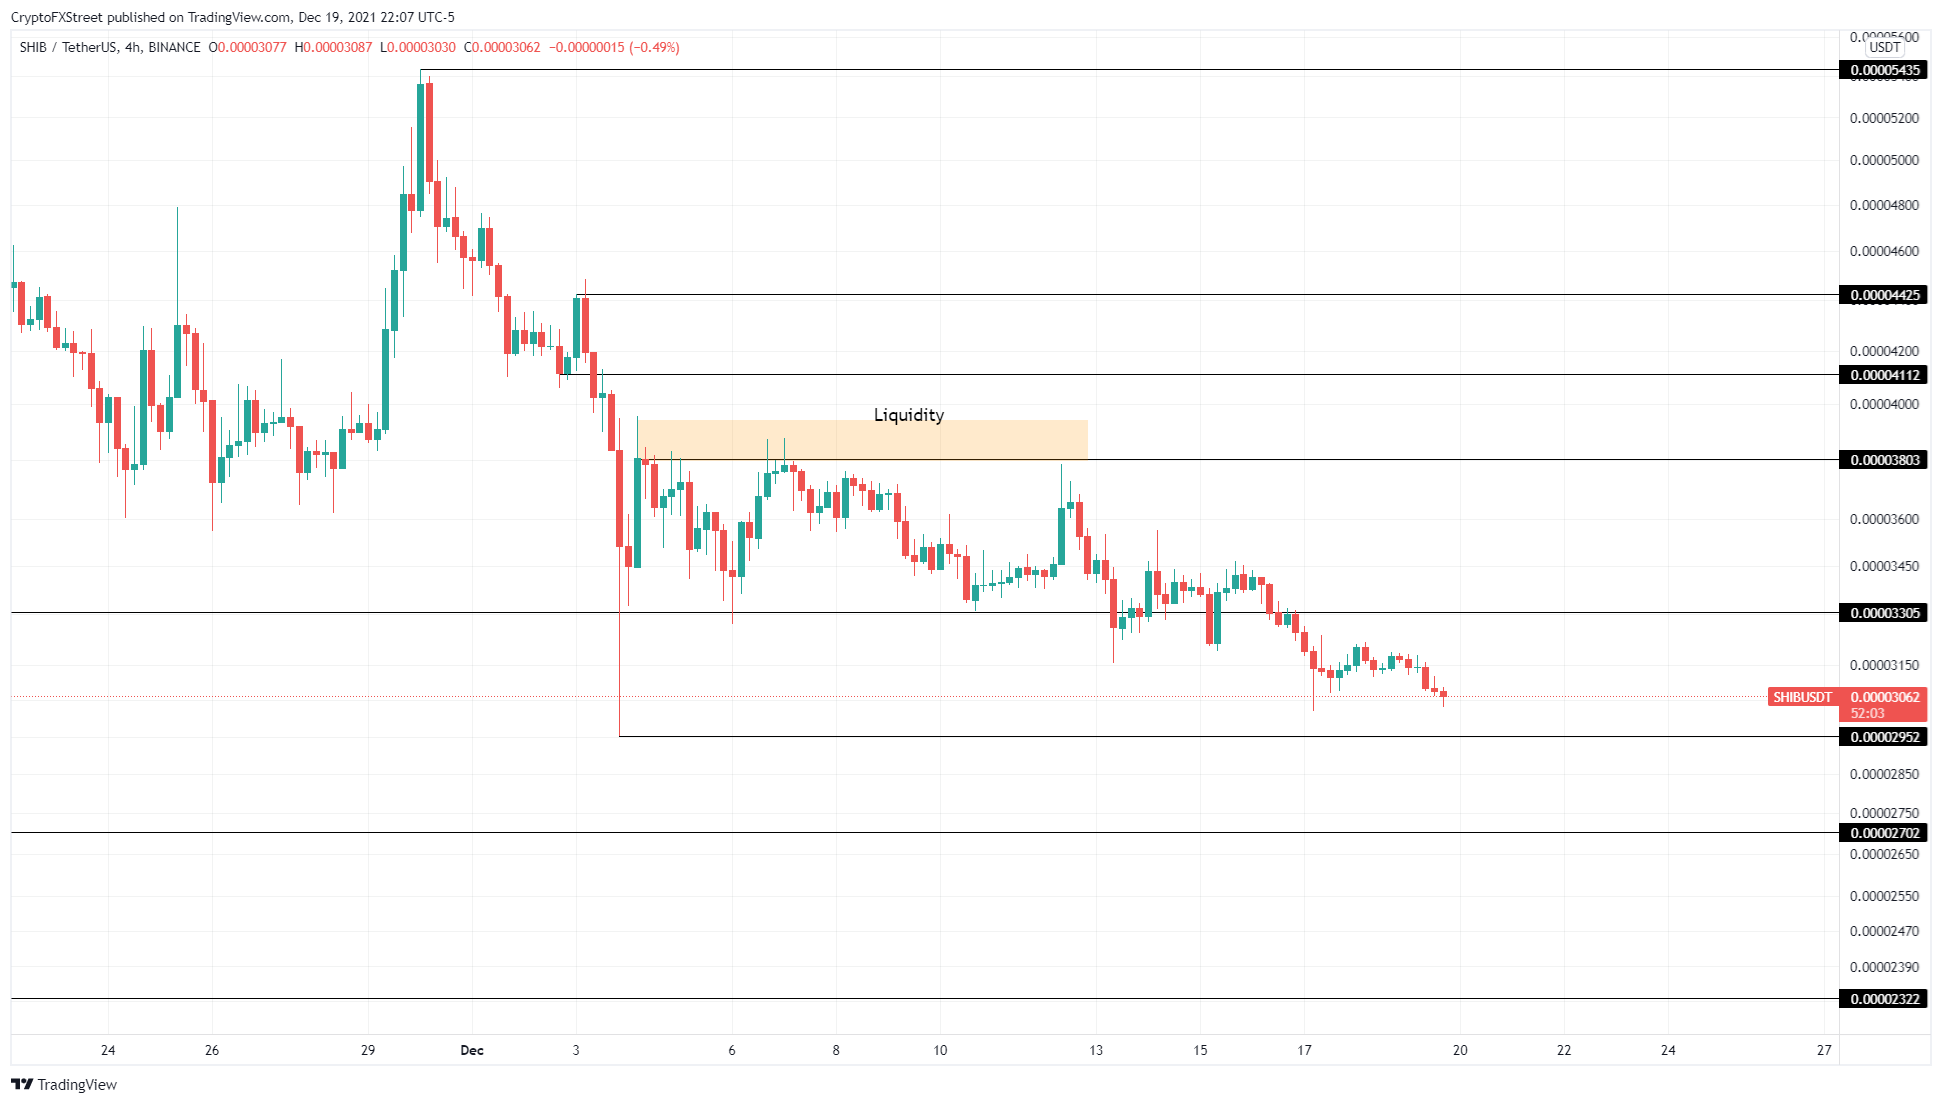
Shiba Inu price has been on a steady downtrend for roughly two months and shows no signs of slowing down. However, investors can expect SHIB to form a base that will result in a reversal of the nosedive.
Shiba Inu price looks for a base
Shiba Inu price has produced roughly four lower lows since the December 4 crash. Due to its downtrend, SHIB is very close to retesting the December 4 swing low at $0.0000295. Investors can expect the meme coin to see some sort of bullish activity around this level, leading to the formation of a base.
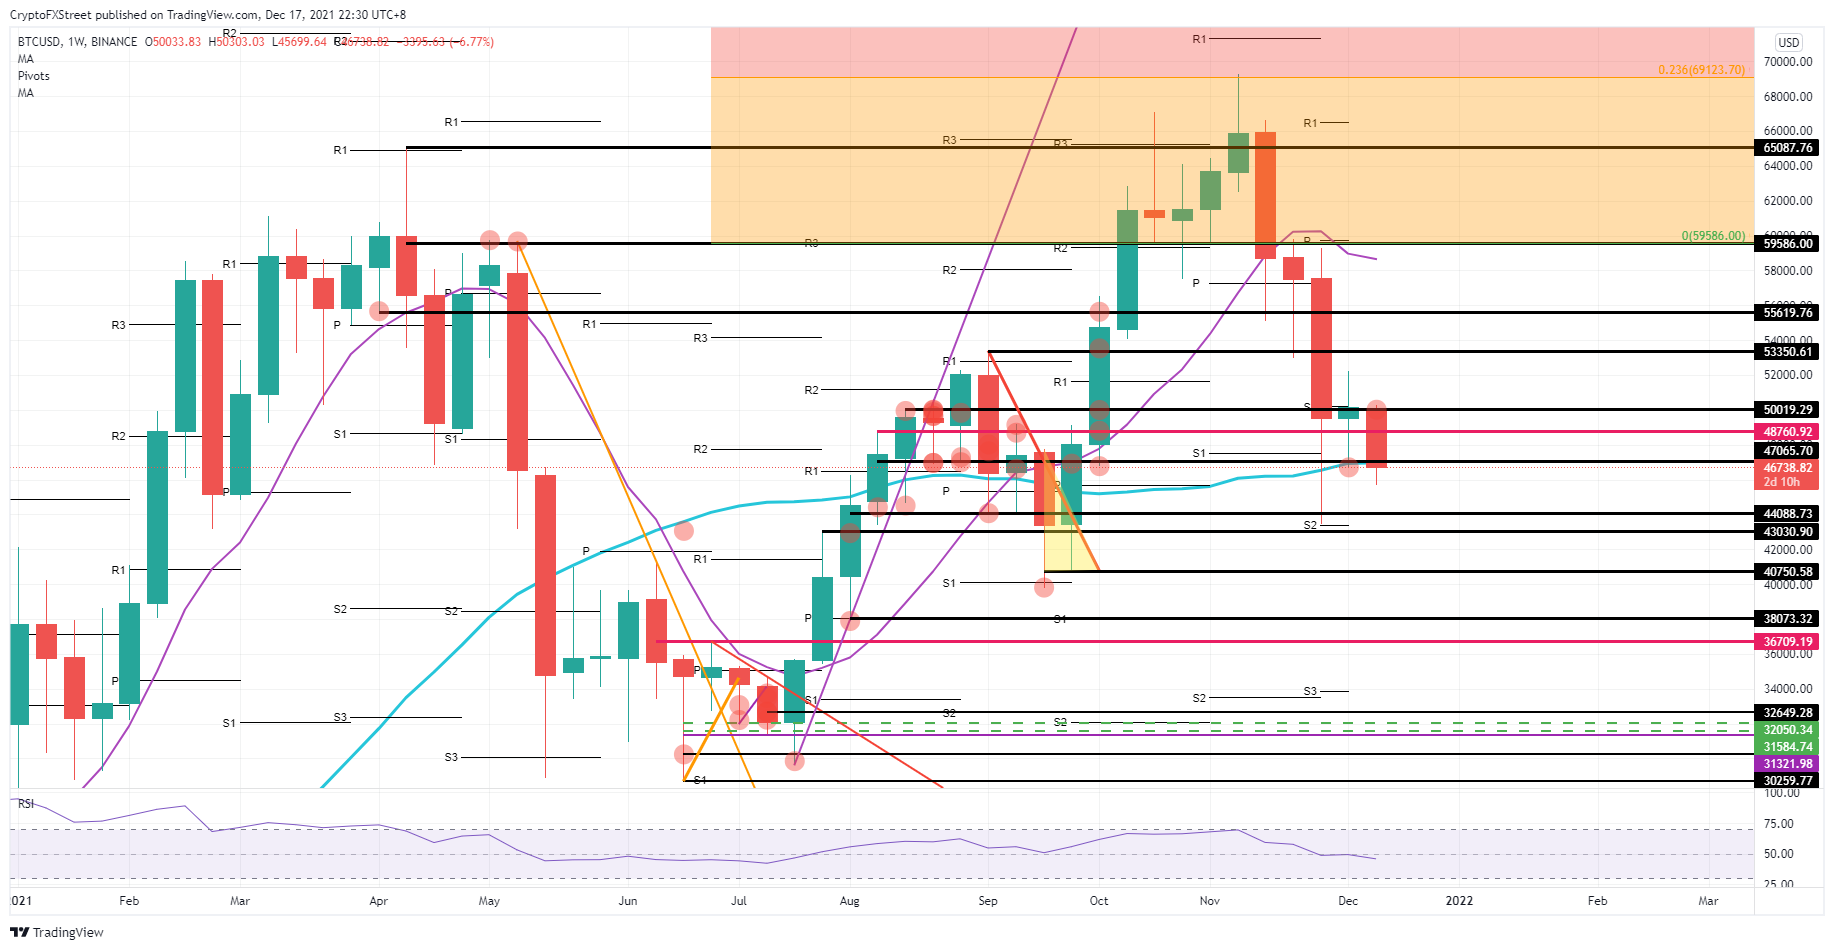
Bitcoin set to make a double bottom, with bullish signs for the new year
Bitcoin (BTC) price saw bulls last week trying to reclaim the $50,000 marker, but this week the attempt got rejected and formed a bull trap in the making. Instead, it looks like BTC will close the year on the back foot. Going into 2022, this means that Bitcoin could see investors picking up the lucrative discount around $44,088-$43,030, with 2022 forecasted to be a grand-cru year with new all-time highs projected over $100,000.
Bitcoin will see investors pick up the discount in these last two trading weeks of 2021
Bitcoin price had bulls looking optimistic last week with a strong recovery back above $50,000. Instead, the bulls got rejected this week at that same level and underwent a squeeze to the downside.
This news is republished from another source. You can check the original article here
Be the first to comment