Bitcoin (CRYPTO: BTC) and Ethereum (CRYPTO: ETH) were trading flat on Tuesday afternoon, after each soared about 26% over the past six days.
Some analysts attribute the sharp increases to a rise in the popularity and necessity of the decentralized crypto sector following harsh Russian sanctions that have left the traditional financial system, at least in Russia, exposed.
From a charting perspective, after a months-long decline, both Bitcoin and Ethereum have developed bullish patterns on their daily charts, which could lead to a larger bull run in the future. Ethereum, however, may have further room to run in the immediate future, because its relative strength index (RSI) has more room to move higher before flashing a warning sign.
It should be noted, however, that events affecting the general markets, negative or positive reactions to earnings prints and news headlines can quickly invalidate patterns and breakouts. As the saying goes, “the trend is your friend until it isn’t” and any trader in a position should have a clear stop set in place and manage their risk versus reward.
In The News: For ordinary Russians, crypto may offer a safe haven from the geopolitical events demolishing their country’s official currency. On Tuesday, the ruble plummeted to a record low of $0.0084 USD after a number of countries moved to block Russia from the Swift international payment system and retail banks in North America and Europe halted business with Russian banks.
Bitcoin and Ethereum may also provide a payment system for the Russian population to make purchases because, in another Tuesday development, Visa Inc (NYSE:V) and Mastercard Inc (NYSE:MA) made the decision to block Russian banks from using their payment networks.
Although, Ukraine Vice Prime Minister Mykhailo Fedorov asked on Sunday for major crypto platforms to freeze the wallets belonging to all Russian citizens. Crypto exchange Binance told Reuters that while it would freeze the accounts of any users who are on the sanctions list, it had no plans to restrict the platform’s access for other Russian clients.
See Also: High Demand For Bitcoin Amid Russian Invasion Lead To Apex Crypto Trading At Big Premium In Ukraine
The Bitcoin Chart: Bitcoin reversed into an uptrend on Feb. 24, which has been confirmed with both a higher low and a higher high. The most recent higher low was printed on Feb. 27 at the $37,020 level and as long as the crypto remains above the area on its next swing lower the uptrend will remain intact.
- Bitcoin may also be setting up an inverted head-and-shoulder pattern on the daily chart, with the left shoulder formed between Feb. 9 and Feb. 16, the head between Feb. 17 and Tuesday and the right shoulder may form over the coming days when Bitcoin prints a higher low.
- If the pattern is recognized, traders can watch for higher-than-average volume to come in if Bitcoin breaks up from the neckline of the pattern.
- The formation of a higher low into the possible right shoulder will also help to cool Bitcoin’s RSI, which is measuring in at about 60%.
- Bitcoin has resistance above at $45,814 and $48,475 and support below at $42,233 and $39,600.
Want direct analysis? Find me in the BZ Pro lounge! Click here for a free trial.
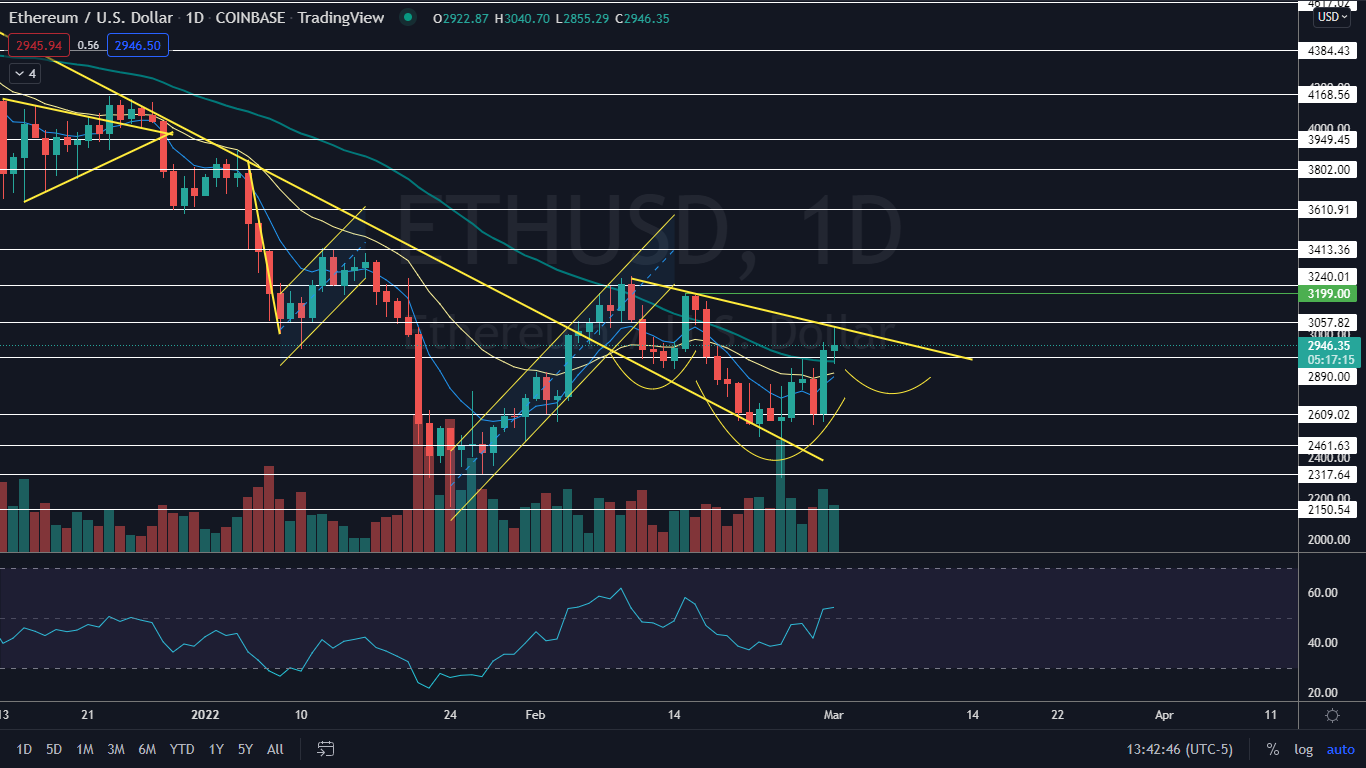
The Ethereum Chart: Like Bitcoin, Ethereum is trading in an uptrend and may also be settling into the right shoulder of the head-and-shoulder pattern, with the internal shapes of the pattern forming over the same timeline as with Bitcoin.
- Ethereum’s RSI is measuring in at just about 53%, which indicates the crypto could trade much higher before entering into overbought territory.
- As with Bitcoin, bullish traders can watch for a break of the neckline on high volume to gauge whether the pattern was recognized.
- Ethereum has resistance above at $3,057 and $3,240 and support below at $2,890 and $2,609.

This news is republished from another source. You can check the original article here

Be the first to comment