

Daronk Hordumrong/iStock via Getty Images
Block (SQ), previously named Square, is best-known for providing card payment technology for sellers, but also sells software to assist merchants (e.g. Square Invoice) and has branched into mobile payment services (Cash App). Cash App also has a brokerage component, in which users can buy and sell stocks and bitcoin. Cash App is not a bank, but provides bank-like services through partnerships.
Block is competing against a host of other companies that are also trying to provide the full suite of banking, payment, lending, and investing services. The big banks offer brokerage and payment apps (such as Zelle). The big brokerage firms offer banking services. And, perhaps the most significant potential disruptor, big tech firms are moving into financial services. Apple just announced plans for a new service that enables small businesses to accept payments via iPhone without any additional hardware.
A lot of enthusiasm (hype?) around SQ has to do with support for trading bitcoin. In mid-2021, bitcoin trading revenue accounted for 70% of SQ’s revenue. Bitcoin has declined substantially from its 2021 peak in early November, and shares of SQ have followed a similar trajectory.
Seeking Alpha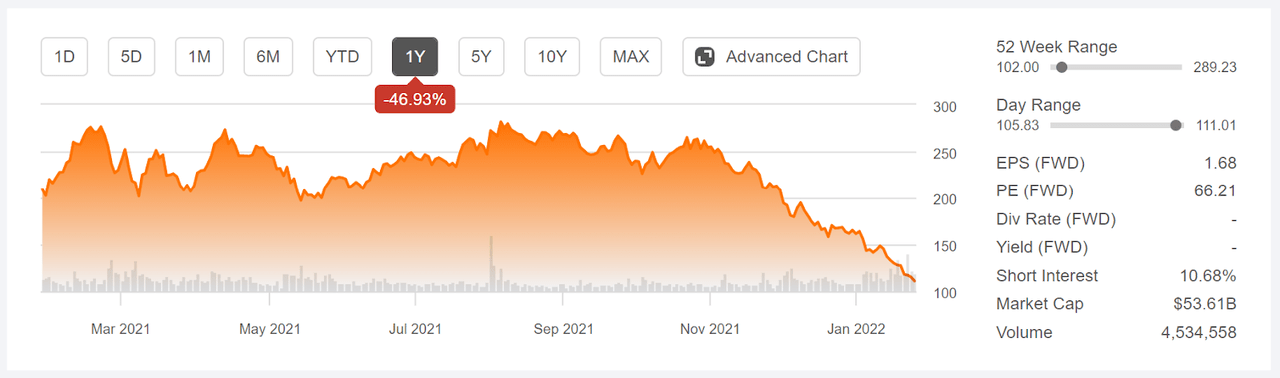
12-Month price history and basic statistics for SQ (Source: Seeking Alpha)
SQ traded as high as $276 early in 2021 and was largely range bound until late October. Since hitting an interim high of $265 in late October, the shares have been on a steady decline and currently trade 56% lower at about $108.
I last wrote about SQ on March 28, 2021, about 10 months ago. At that time, I gave the shares a neutral / hold rating because there was a substantial disconnect between the consensus outlook from Wall Street analysts and the market-implied outlook, which reflects the consensus view of buyers and sellers of options on SQ. The Wall Street consensus 12-month price target was about 25% above the share price at that time and the consensus rating was bullish. By contrast, the options market was indicating a high probability of significant price declines to mid-January of 2022. Since that post, SQ has fallen 49% vs. a 10.6% price gain for the S&P 500.
Seeking Alpha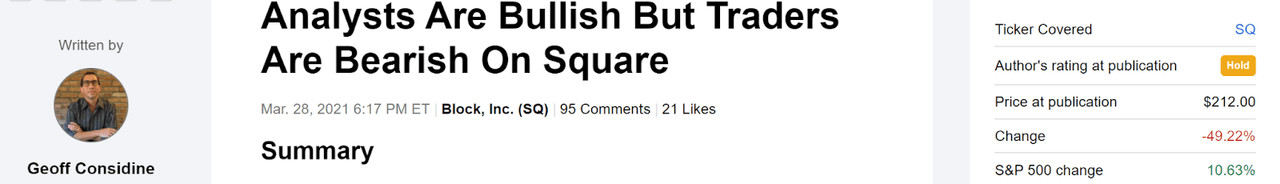
Performance of SQ since my analysis on March 28, 2021 (Source: Seeking Alpha)
The price of an option on a stock reflects the market’s consensus estimate of the probability that the shares will rise above (call option) or fall below (put option) a specific level (the option strike price) between now and when the option expires. By analyzing the prices of call and put options at a range of strike prices, all with the same expiration date, it is possible to calculate a probabilistic price return forecast that reconciles all of the options prices. This is the market-implied outlook and represents the consensus market view implied by options trading.
It is not uncommon to find cases in which the market-implied outlook substantially disagrees with the Wall Street analyst consensus outlook, although the March 2021 results for SQ were notable. The most-probable outcome in the market-implied outlook for SQ from March 28, 2021 to January 21, 2022 was a price return of -25% as compared to the Wall Street consensus 12-month price target that was 25% above the share price at that time. The annualized volatility calculated from the market-implied outlook was 49%, which is very high for an individual stock. Examples of other stocks exhibiting this kind of major disconnect between the Wall Street consensus and the market-implied outlook include Teladoc (NYSE:TDOC), Twitter (NYSE:TWTR), and Moderna (NASDAQ:MRNA).
With 10 months since my last analysis, over which SQ has fallen more than 49%, I have updated the market-implied outlook for SQ through 2022 and, as before, compared with the Wall Street consensus outlook.
Wall Street Consensus Outlook for SQ
ETrade calculates the Wall Street consensus outlook for SQ by combining the views of 23 ranked analysts who have published ratings and price targets over the past 90 days. The consensus rating for SQ is bullish, as it has been through the last 12 months, and the consensus 12-month price target 121% above the current share price. The dispersion among the individual share price targets is very high, reducing confidence in the predictive value of the consensus. When I see a spread of around 2X or greater between the lowest and highest analyst price targets, I discount the consensus view. Of the 23 analysts, 17 assign a buy rating and 6 give SQ a hold rating.
ETrade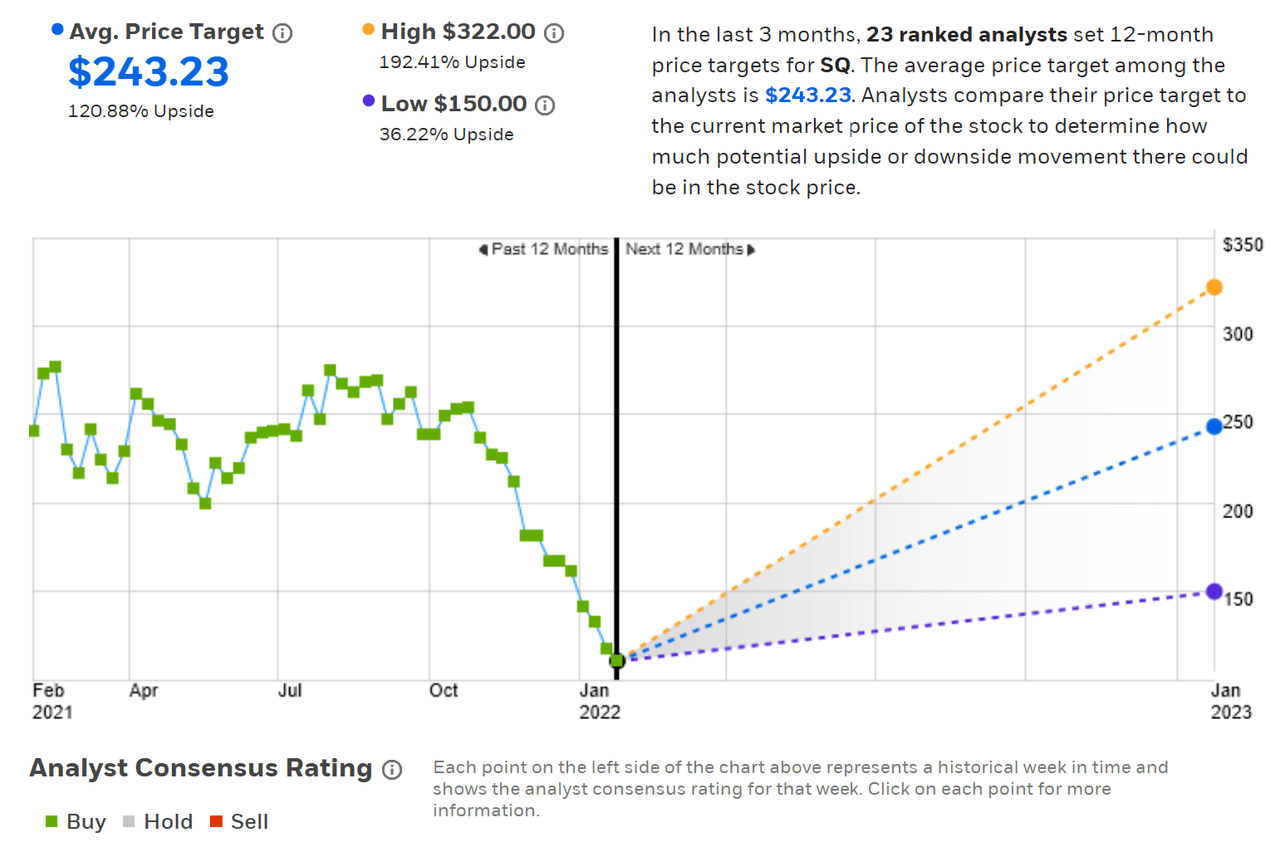
Wall Street analyst consensus rating and 12-month price target for SQ (Source: ETrade)
Seeking Alpha calculates the Wall Street consensus outlook using the views of 42 analysts who have published their opinions within the past 90 days. The consensus rating is bullish and the consensus 12-month price target is almost identical to the value calculated by ETrade.
Seeking Alpha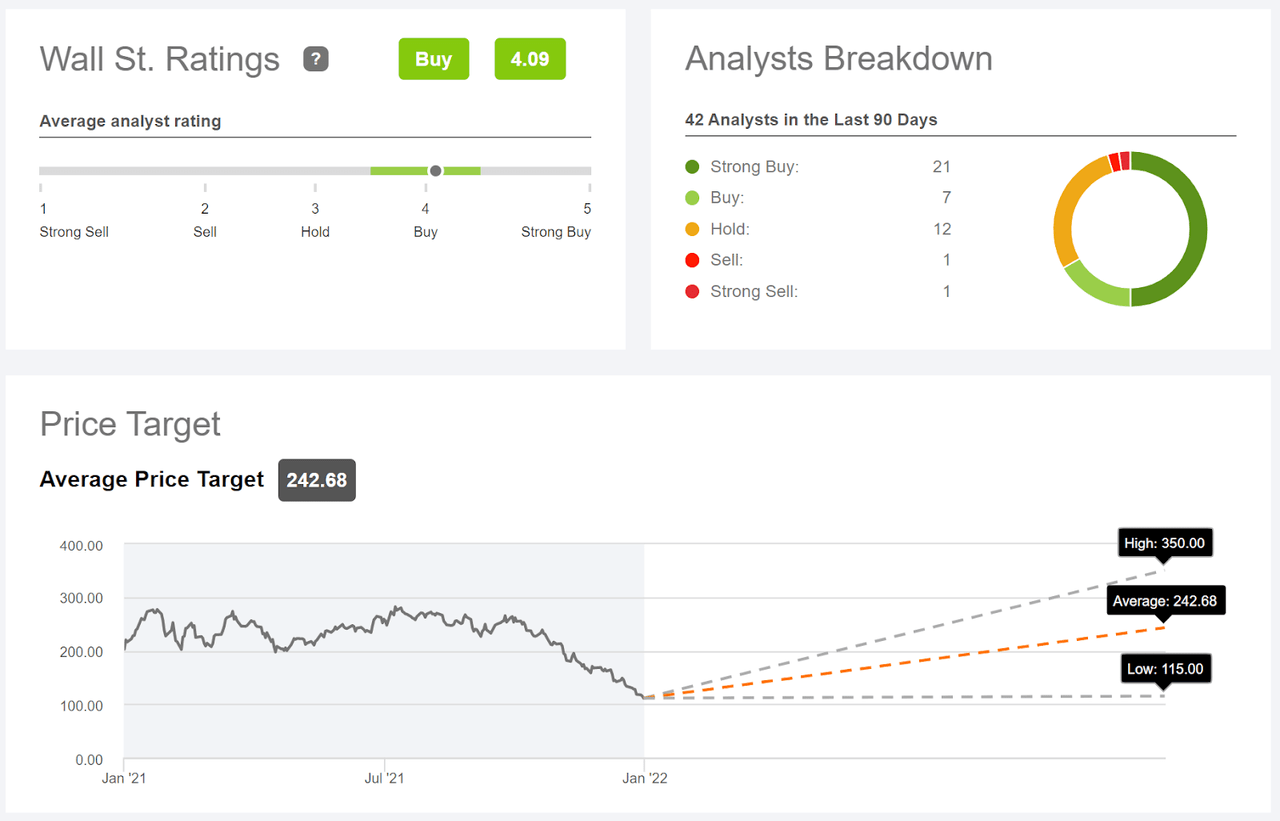
Wall Street analyst consensus rating and 12-month price target for SQ (Source: Seeking Alpha)
It is unusual to see cases in which the Wall Street consensus implies that stock in a company is expected to gain more than 100% in the next 12 months. SQ’s share price has fallen very quickly, creating a massive spread vs. the price targets. It appears that the consensus view among the analysts was that SQ’s revenue growth from bitcoin was sustainable.
Market-Implied Outlook for SQ
I have calculated the market-implied outlooks to the middle of 2022 (using options that expire on June 17, 2022) and for the next year (using options that expire on January 20, 2023).
The standard presentation of the market-implied outlook is in the form of a probability distribution of price return, with probability on the vertical axis and return on the horizontal.
Geoff Considine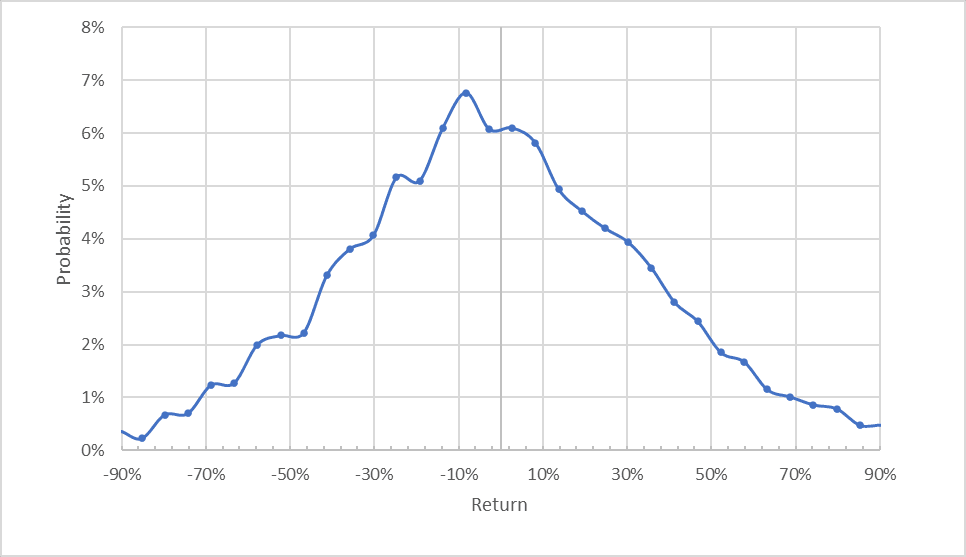
Market-implied price return probabilities for SQ for the 4.6-month period from now until June 17, 2022 (Source: Author’s calculations using options quotes from ETrade)
The market-implied outlook between now and June 17, 2022 is generally symmetric, with comparable probabilities of positive and negative returns of the same magnitude, but the maximum probabilities are tilted slightly to favor negative returns over this period. The maximum probability outcome corresponds to a price return of -8% over the next 4.6 months. The annualized volatility calculated from this outlook is 62.1%, which is high for an individual stock. The 20th percentile price return (worst 1-in-5 outcomes will be at or below this level) is -31.5% for this period. The 80th percentile (highest 1-in-5 outcomes will be at or above this level) is +30.8%. This is a dramatic projected range for a 4.6-month period.
Theory suggests that the market-implied outlook will tend to have a negative bias because risk-averse investors pay more than fair value for downside protection (e.g. put options). The market-implied outlook must be considered with consideration of the expected negative bias, although there is no robust way to estimate how large this bias may be.
To make it easier to directly compare the probabilities of positive and negative returns, I rotate the negative return side of the distribution about the vertical axis (see chart below).
Geoff Considine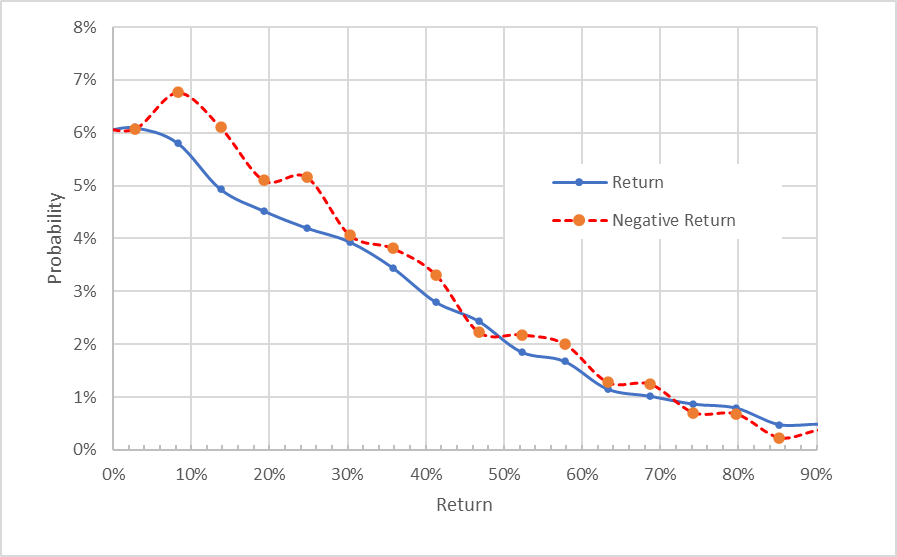
Market-implied price return probabilities for SQ for the 4.6-month period from now until June 17, 2022. The negative return side of the distribution has been rotated about the vertical axis (Source: Author’s calculations using options quotes from ETrade)
This view clearly shows the elevated probabilities of negative returns for a range of outcomes (the red dashed line is above the solid blue line on the left half of the chart above). Considering the potential for negative bias, I interpret this outlook as neutral with a slight bearish tilt.
The market-implied outlook for the next year (calculated using options that expire on January 20, 2023) is substantially bearish. The maximum probability outcome corresponds to a price return of -24% over the next 11.8 months. The annualized volatility calculated from this outlook is 54.5%. The probabilities of negative returns are well above those of positive returns of the same scale for a wide range of the most-probable outcomes (the red dashed line is well above the solid blue line over the left half of the chart).
There is a secondary peak in the negative return probabilities which corresponds to a 100% loss. The long tail on positive returns indicates that there is a low probability of very large gains. The 97th percentile price return is +120%, which indicates that there is a 3% probability of having a price return of 120% or more. The probabilities of tail events in the market-implied outlook are not considered reliable. I am looking at this particular outcome because the Wall Street consensus price target corresponds to a price return of +120% over the next 12 months. This is a dramatic disconnect.
Geoff Considine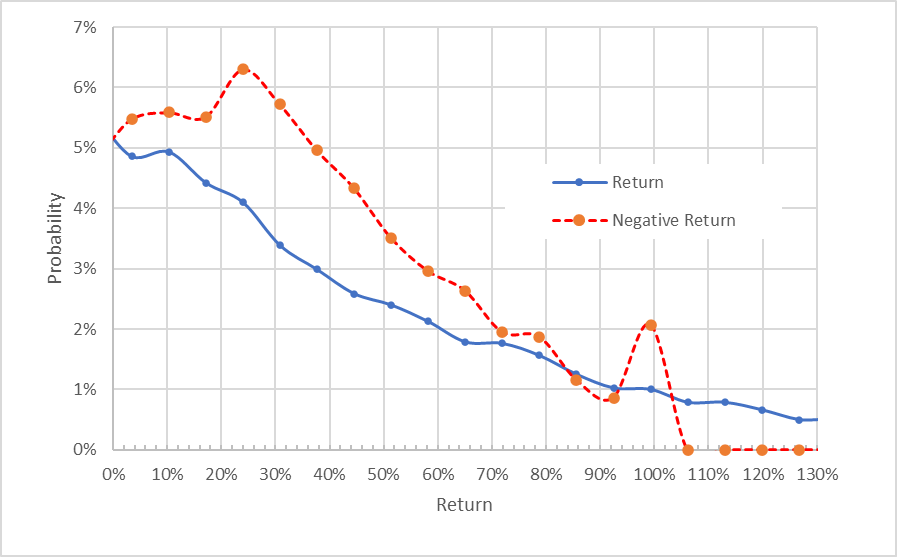
Market-implied price return probabilities for SQ for the 11.8-month period from now until January 20, 2023. The negative return side of the distribution has been rotated about the vertical axis (Source: Author’s calculations using options quotes from ETrade)
The market-implied outlook is neutral with a bearish tilt for the first half of 2022, shifting to a solidly bearish outlook for the next year. The expected volatility is slightly lower for the full year than for the first half, but is still very high at 54.5%.
Summary
Near the end of March of 2021, when SQ was trading at $212, the Wall Street consensus outlook for SQ was bullish, with a 12-month price target that was 25% higher than the share price at that time. The market-implied outlook to January 21, 2022 was substantially bearish, with the maximum probability corresponding to a price return of -25%. Today, SQ is trading at about $111 and there is the same divergence between the Wall Street consensus and the market-implied outlook, although the spread is even higher. The Wall Street consensus price 12-month price target is 120% above the current share price and the market-implied outlook to January 20, 2023 has the maximum probability at -24%. There is an extremely large spread in the analyst price targets, which leads me to somewhat discount the consensus. Both the Wall Street analyst price targets and the market-implied outlooks indicate massive uncertainty for SQ over the next year. Compromising between the bullish view from the analysts and the bearish view from the options market for the next year, I am maintaining my neutral rating.
This news is republished from another source. You can check the original article here
Be the first to comment