- Bitcoin price dips into the $19,284-to-$20,726 demand zone, pushing into a point of a potential reversal.
- Ethereum price looks to find a stable support floor to trigger a breakout of the $1,284 hurdle.
- Ripple price might revisit the four-hour demand zone, extending from $0.286 to $0.306, in an attempt to rally.
Bitcoin price is retracing to a stable support area which suggests a potential rally might be on its way. This development has also pushed Ethereum, Ripple and other altcoins down before the recovery bounce appears.
Bitcoin price at a reversal point
Bitcoin price is dipping into the $19,284-to-$20,726 demand zone, which could result in a potential reversal that pushes BTC higher. This run-up could trigger a rally that could retest the $25,000 level.
For this to happen, Bitcoin price needs to flip the 200-week Simple Moving Average (SMA) at $22,629. Hence, investors need to wait for confirmation to position themselves in the right direction.
BTC/USD 1-day chart
While things are looking up, Bitcoin price needs to respect the $19,284-to-$20,726 demand zone to have a chance at the mentioned rally. A daily candlestick close below $19,284 will invalidate the bullish thesis.
Ethereum price searches for a footing
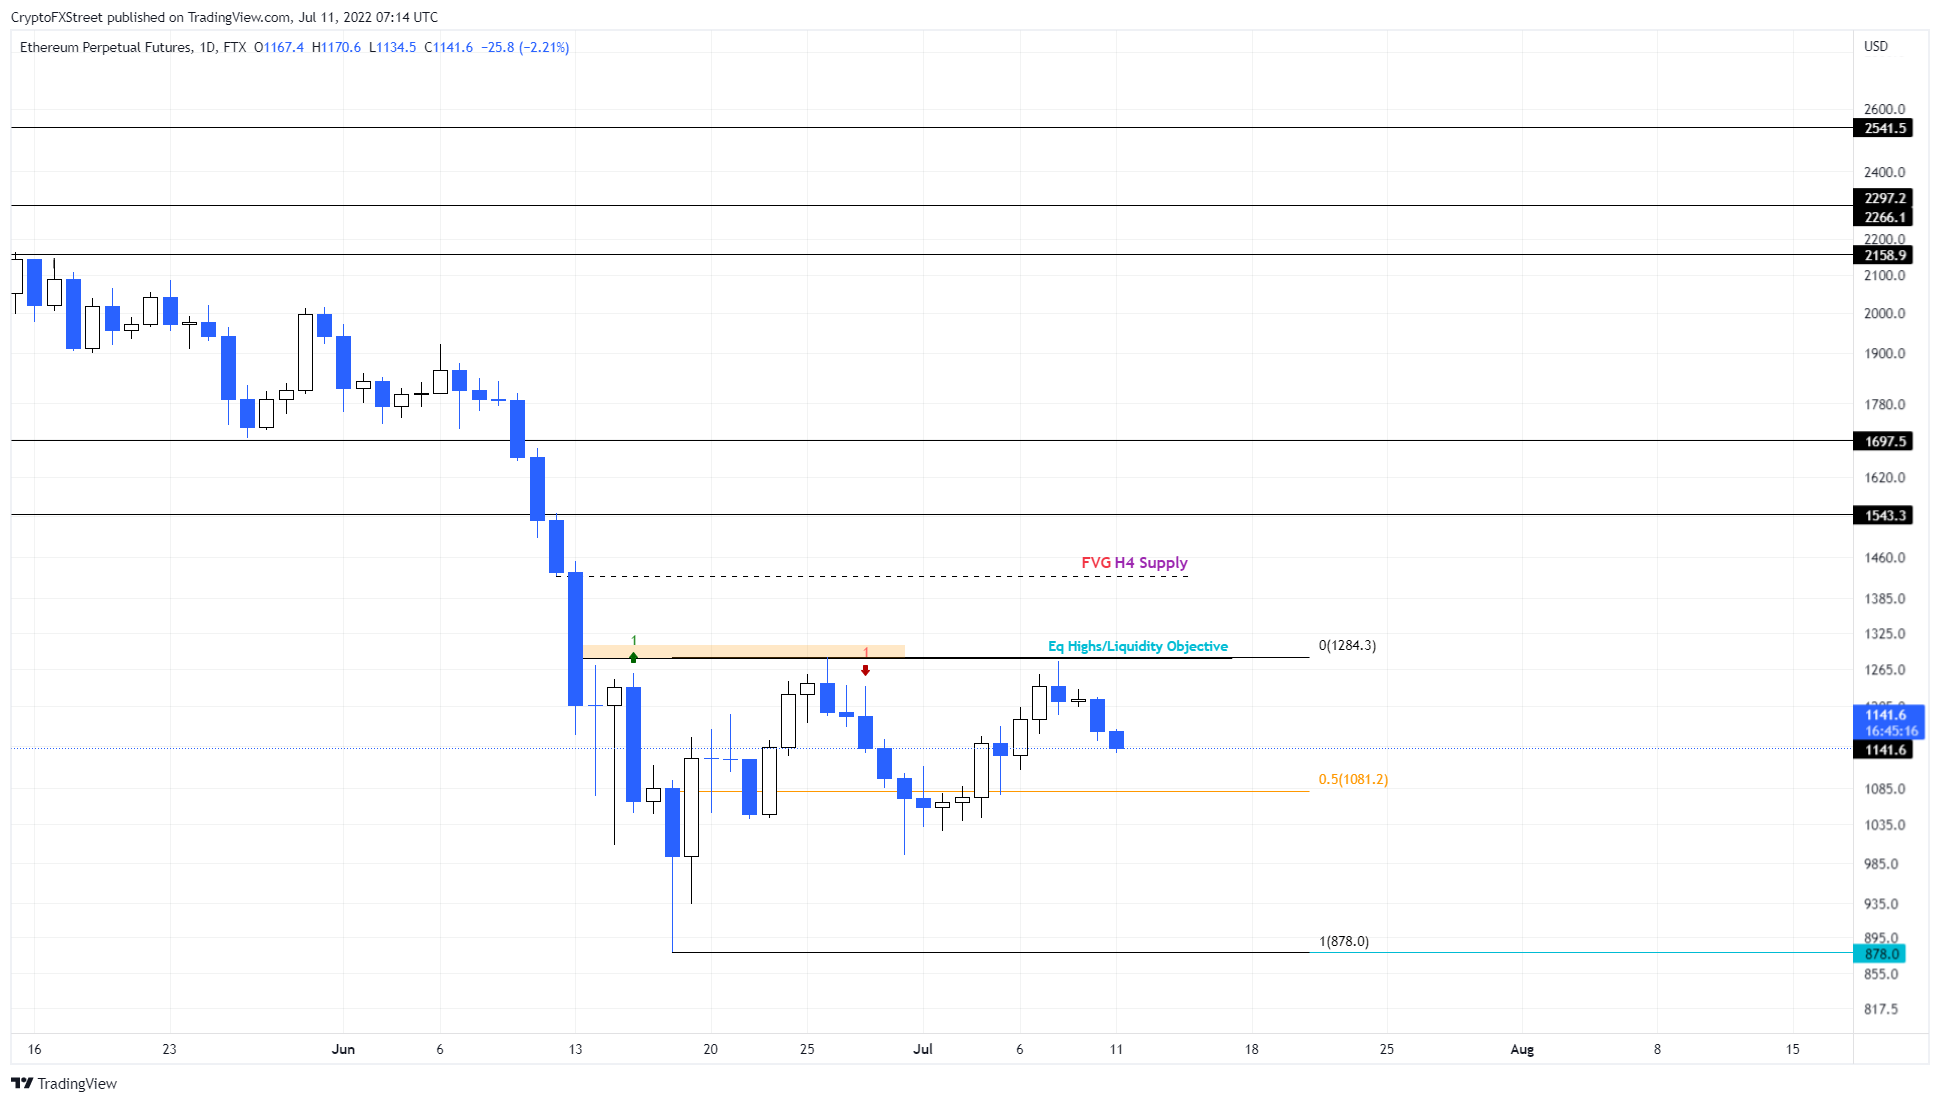
Ethereum price is looking to find a stable support floor after getting rejected off the $1,284 resistance level. The midpoint of the $878-to-$1,284 range at $1,081 is likely the key level where buyers might step in.
Assuming this comeback does occur, investors can expect ETH to try and break out above the $1,284 hurdle. Doing so will open the path for Ethereum price to retest the subsequent levels at $1,543 and $1,697.

ETH/USD 1-day chart
Regardless of the bullishness, a breakdown of the June 30 swing low at $994 will invalidate the bullish thesis for Ethereum price by producing a lower low. In such a case, ETH might retrace to the range low at $878.
Ripple price needs liquidity injection
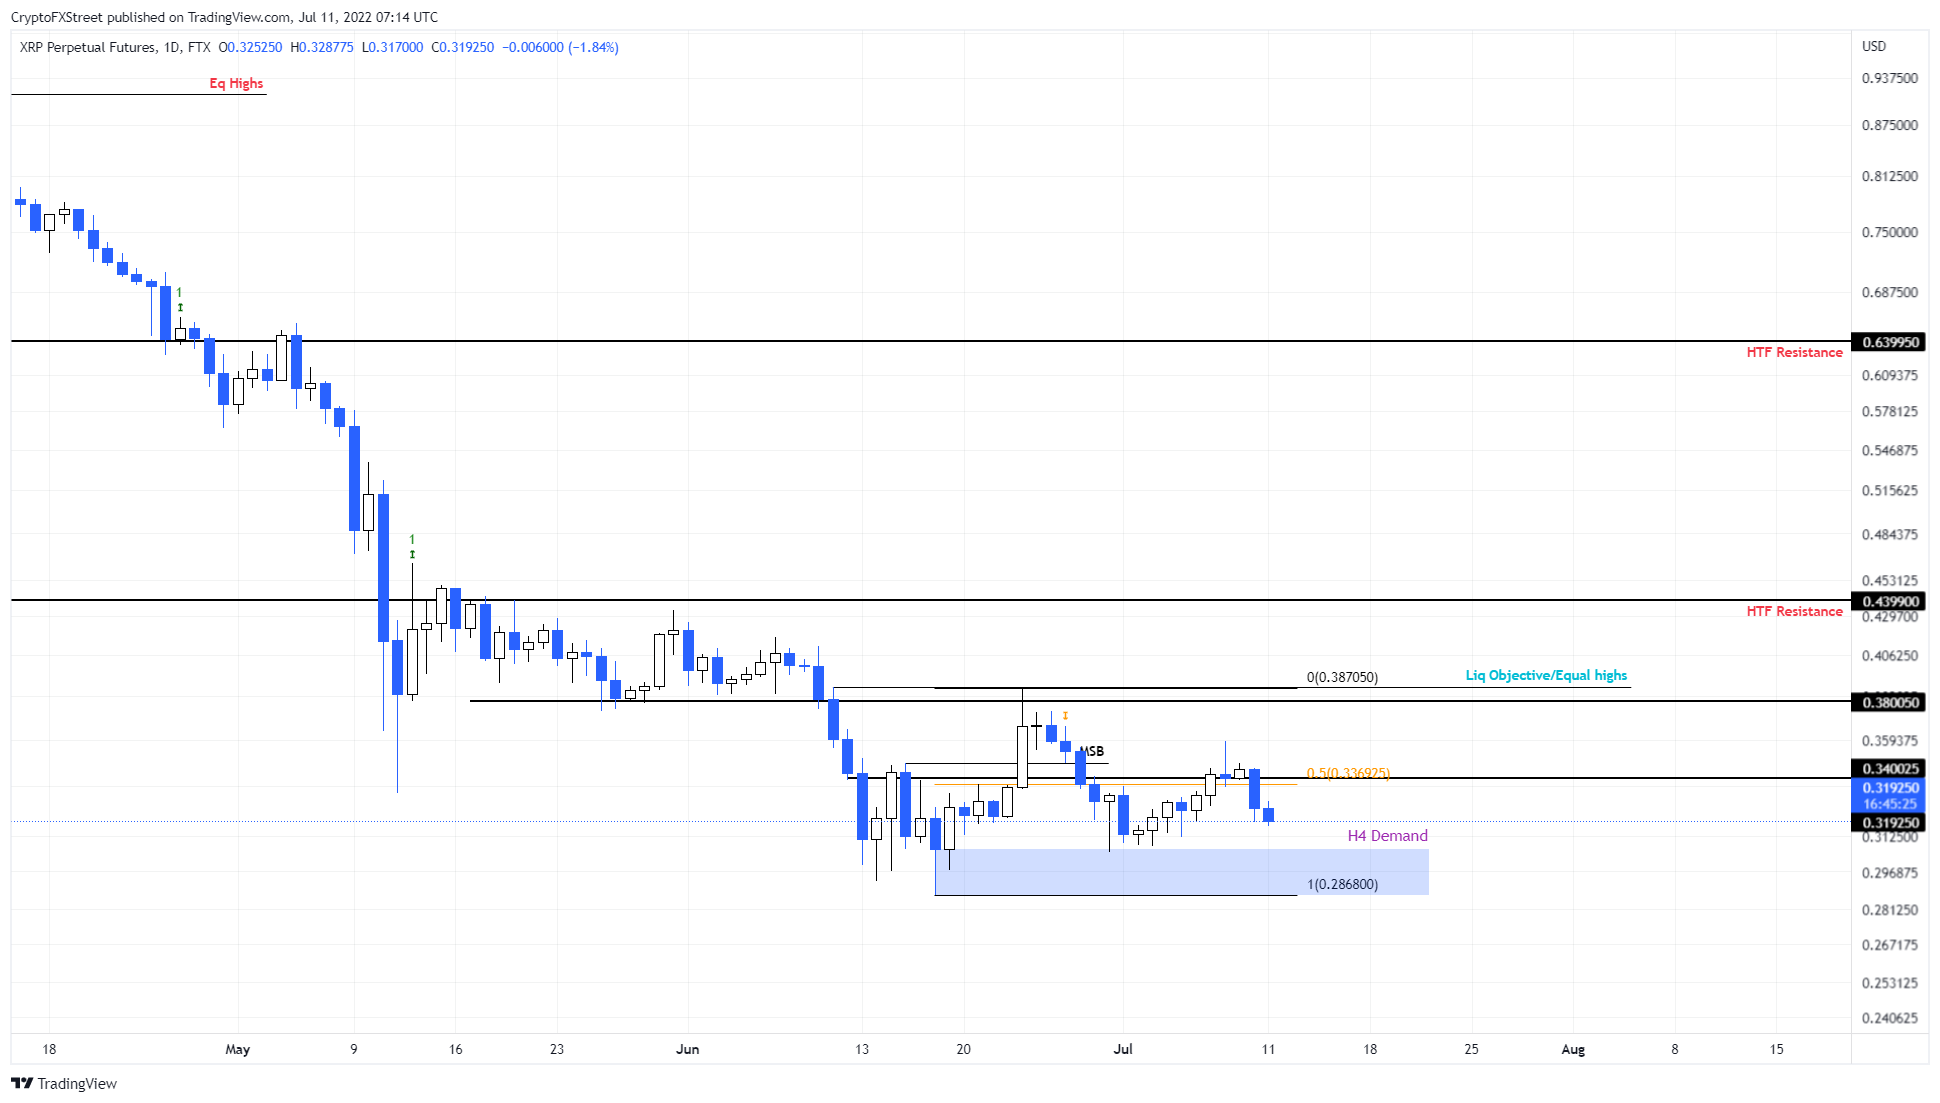
Ripple price attempted to rally after a dip into the four-hour demand zone, extending from $0.286 to $0.306. This move pushed XRP price up by 17% and above the midpoint of the range at $0.336. However, the bulls failed to sustain it, leading to a retracement.
The pullback is heading back into the aforementioned demand zone, where buyers have another chance at a comeback. Assuming the bullish momentum locks in and triggers a run-up, market participants can expect XRP price to make a run for the range high at $0.387, coinciding with the equal highs.

XRP/USD 1-day chart
On the other hand, if Ripple price slices through the immediate support level and produces a daily candlestick close below $0.286, it will invalidate the bullish thesis.
This news is republished from another source. You can check the original article here

Be the first to comment