
- Bitcoin price is taking another jab at the weekly supply zone, extending from $45,550 to $51,860.
- Ethereum price needs to sustain above the 50-day SMA at $3,070 to restart its uptrend.
- Ripple price eyes a preemptive bull rally as bears fail to crash the altcoin lower.
Bitcoin price seems ready for another uptrend as it recovers from its recent pullback. This resurgence of bullish momentum for BTC seems to be seeping into Ethereum, Ripple and other altcoins.
Bitcoin price takes another jab
Bitcoin price rallied 26% and retested the weekly supply zone, ranging from $45,550 to $51,860. This move took a brief timeout on February 2 and set up a demand zone, extending from $36,398 to $38,895.
Although BTC did not retest this barrier, it is attempting another leg-up after a minor retracement for three days. Assuming the bullish momentum continues to pour in, Bitcoin price will take a jab at flipping the weekly supply zone. In such a case, a daily candlestick close above $51,860 will create a higher high and invalidate the bearish thesis.
BTC/USD 1-day chart
In some cases, the uptrend detailed above might occur after a retest of the intermediate demand zone. On the contrary, if Bitcoin price slices through this support area, it will indicate that the bears are in control. This development will also suggest that BTC is likely to continue sliding lower.
Ethereum price clears a crucial hurdle
Ethereum price failed to breach through the 50-day Simple Moving Average (SMA) on February 9 and 10, but its recovery rally has managed to produce a daily candlestick close above it. This move, while impressive, needs to hold above it to confirm a successful breakout.
Assuming buyers keep Ethereum price above the 50-day SMA at $3,070, it will suggest that the rally will continue heading higher. The 50-day and 200-day SMAs confluence at roughly $3,600 is where the upside is likely capped.
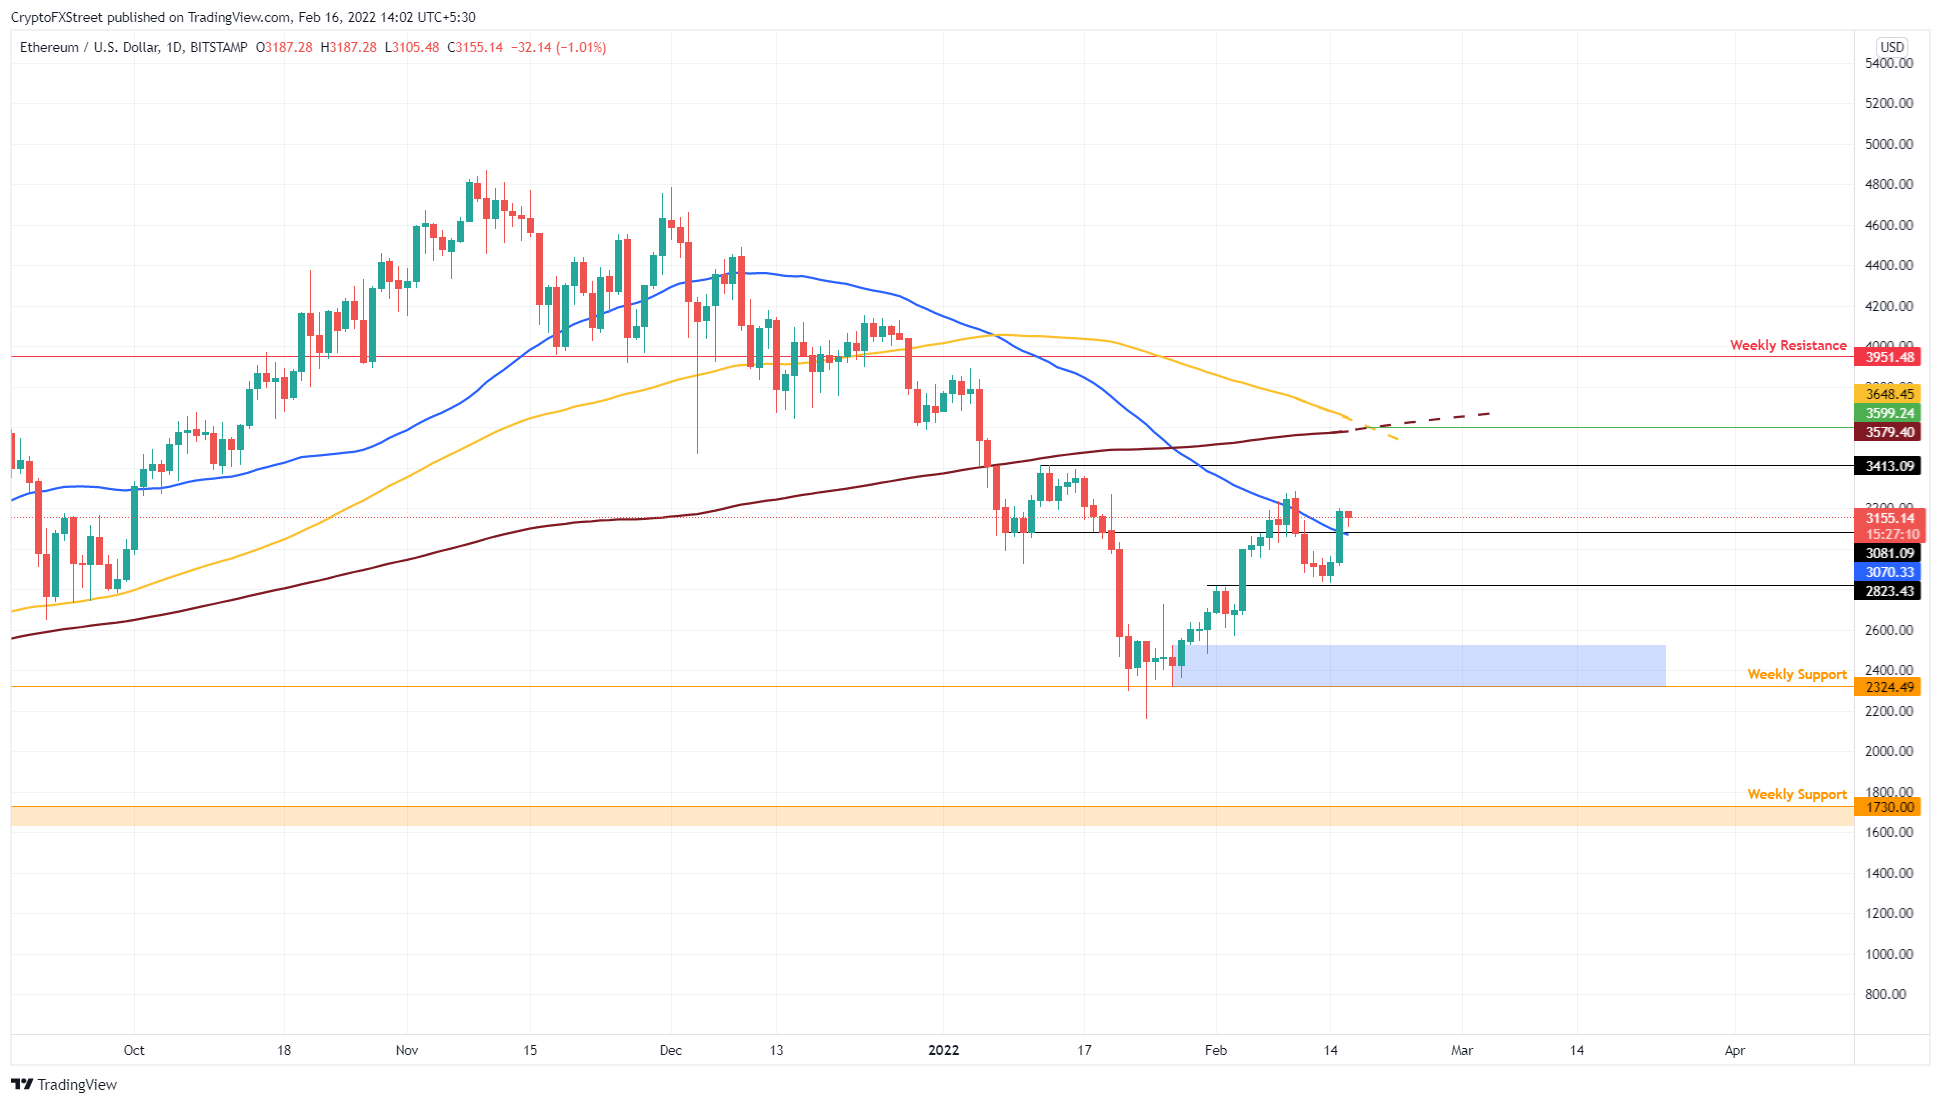
ETH/USD 1-day chart
If Ethereum price fails to hold above the 50-day SMA at $3,070, it will suggest that the downtrend is likely to extend to $2,317 to $2,525 demand zone. While this downtrend might seem bearish, buyers have a chance to come back here. But a daily candlestick close below $2,317 will invalidate the bullish thesis.
Ripple price eyes continuation bullish outlook
Ripple price rallied 55% between February 3 and 8, setting up a local top at $0.915. Since then, the remittance token has retraced 18% and found support around the 50% retracement level at $0.731.
Like many altcoins, XRP price has bounced off this barrier and triggered a minor uptick. This run-up has the potential to extend the overall gains to $1. This move will allow market makers to collect the liquidity resting above this psychological barrier.
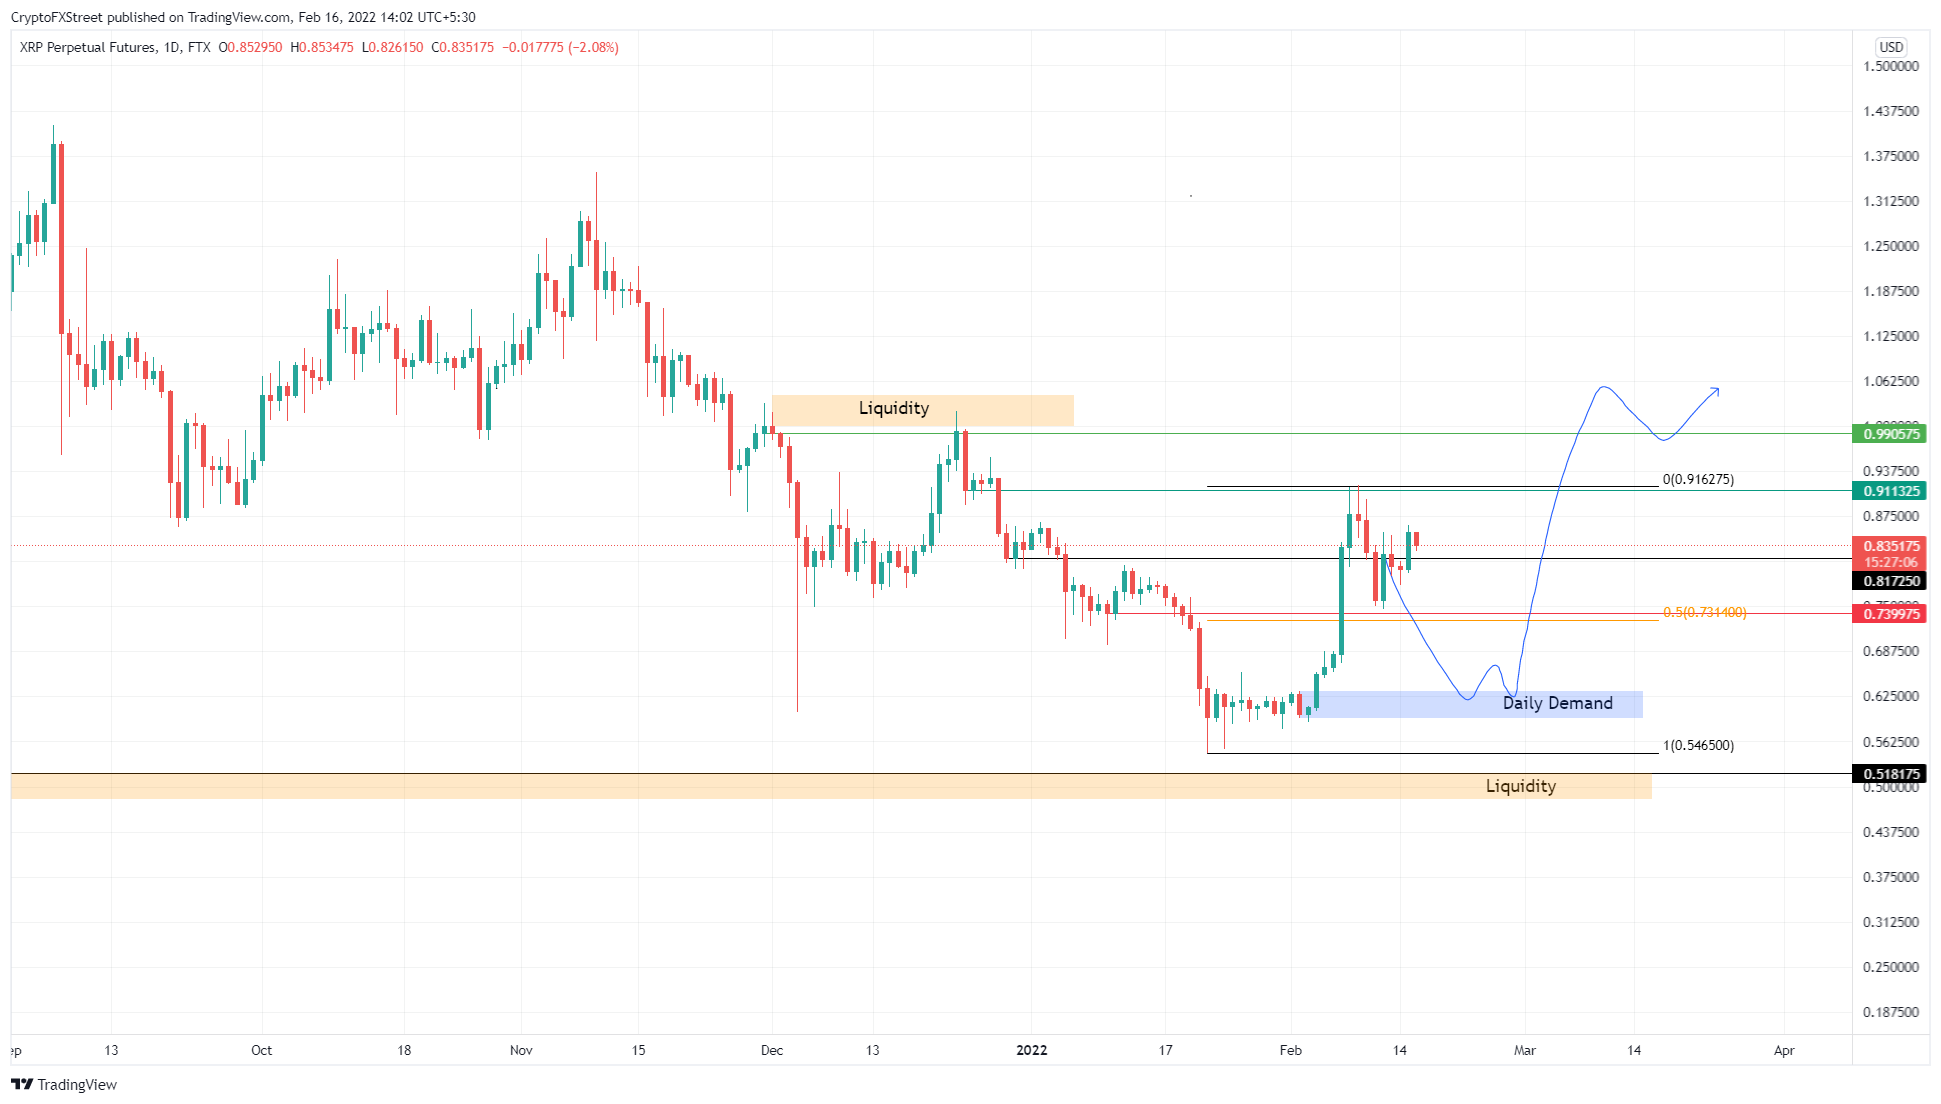
XRP/USD 1-day chart
On the other hand, the rally could restart after a retracement to the daily demand zone, extending from $0.595 to $0.632. This move will allow sidelined buyers to accumulate XRP at a discount, allowing Ripple price to shatter through intermediate barriers and make a run for the $1 psychological barrier.
If XRP price produces a daily candlestick close below $0.595, the bullish thesis will face invalidation, suggesting that Ripple might revisit the $0.518 support level.
This news is republished from another source. You can check the original article here
Be the first to comment