

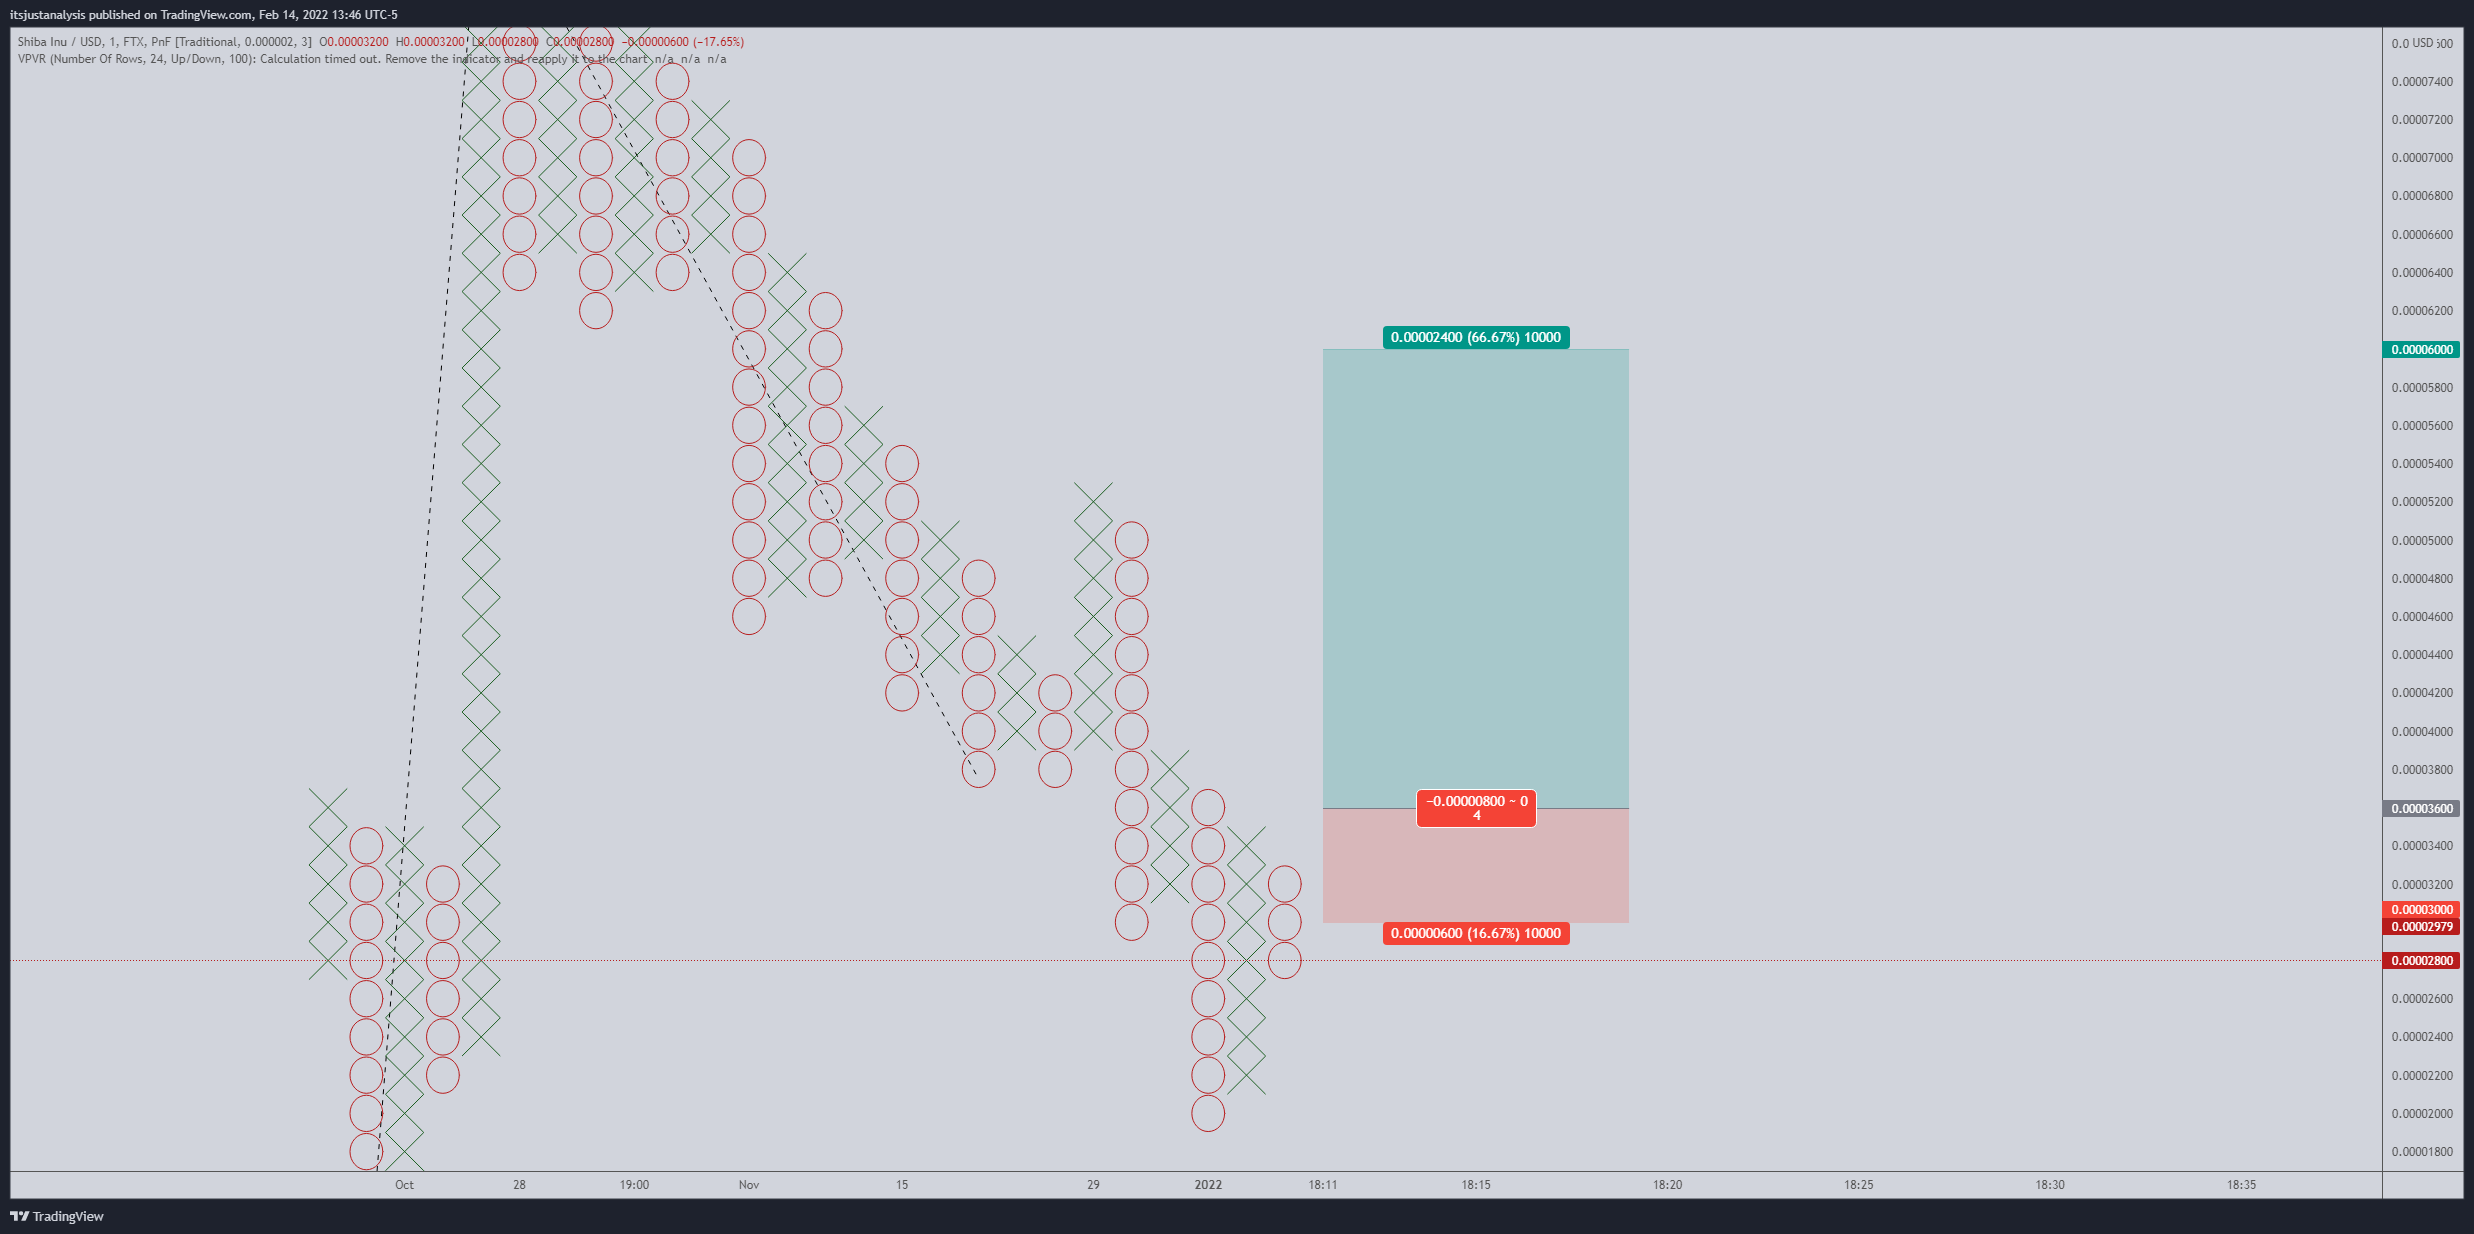
Shiba Inu (SHIBAUSD) $0.000002/3-box Reversal Point and Figure Chart
 Above: Shiba Inu (SHIBAUSD)
Shiba Inu had a fantastic rally recently, moving up over 70% from $0.000022 to $0.000034. The recent pullback is likely just that – a minor pullback before resuming its former rise. The trade setup is a buy stop at $0.000036, a stop loss at $0.000039, and a profit target at $0.000060.
The trade idea represents a 4:1 reward for the risk setup with an implied profit target of 66.67% from the entry. A trailing stop of two to three boxes would help protect any profit made after the entry is triggered.
However, the probability of the reversal column moving directly to the projected profit target is not high that rarely happens. So instead, it may be prudent to split the trade into three or four smaller trades with profit taken on the way up.
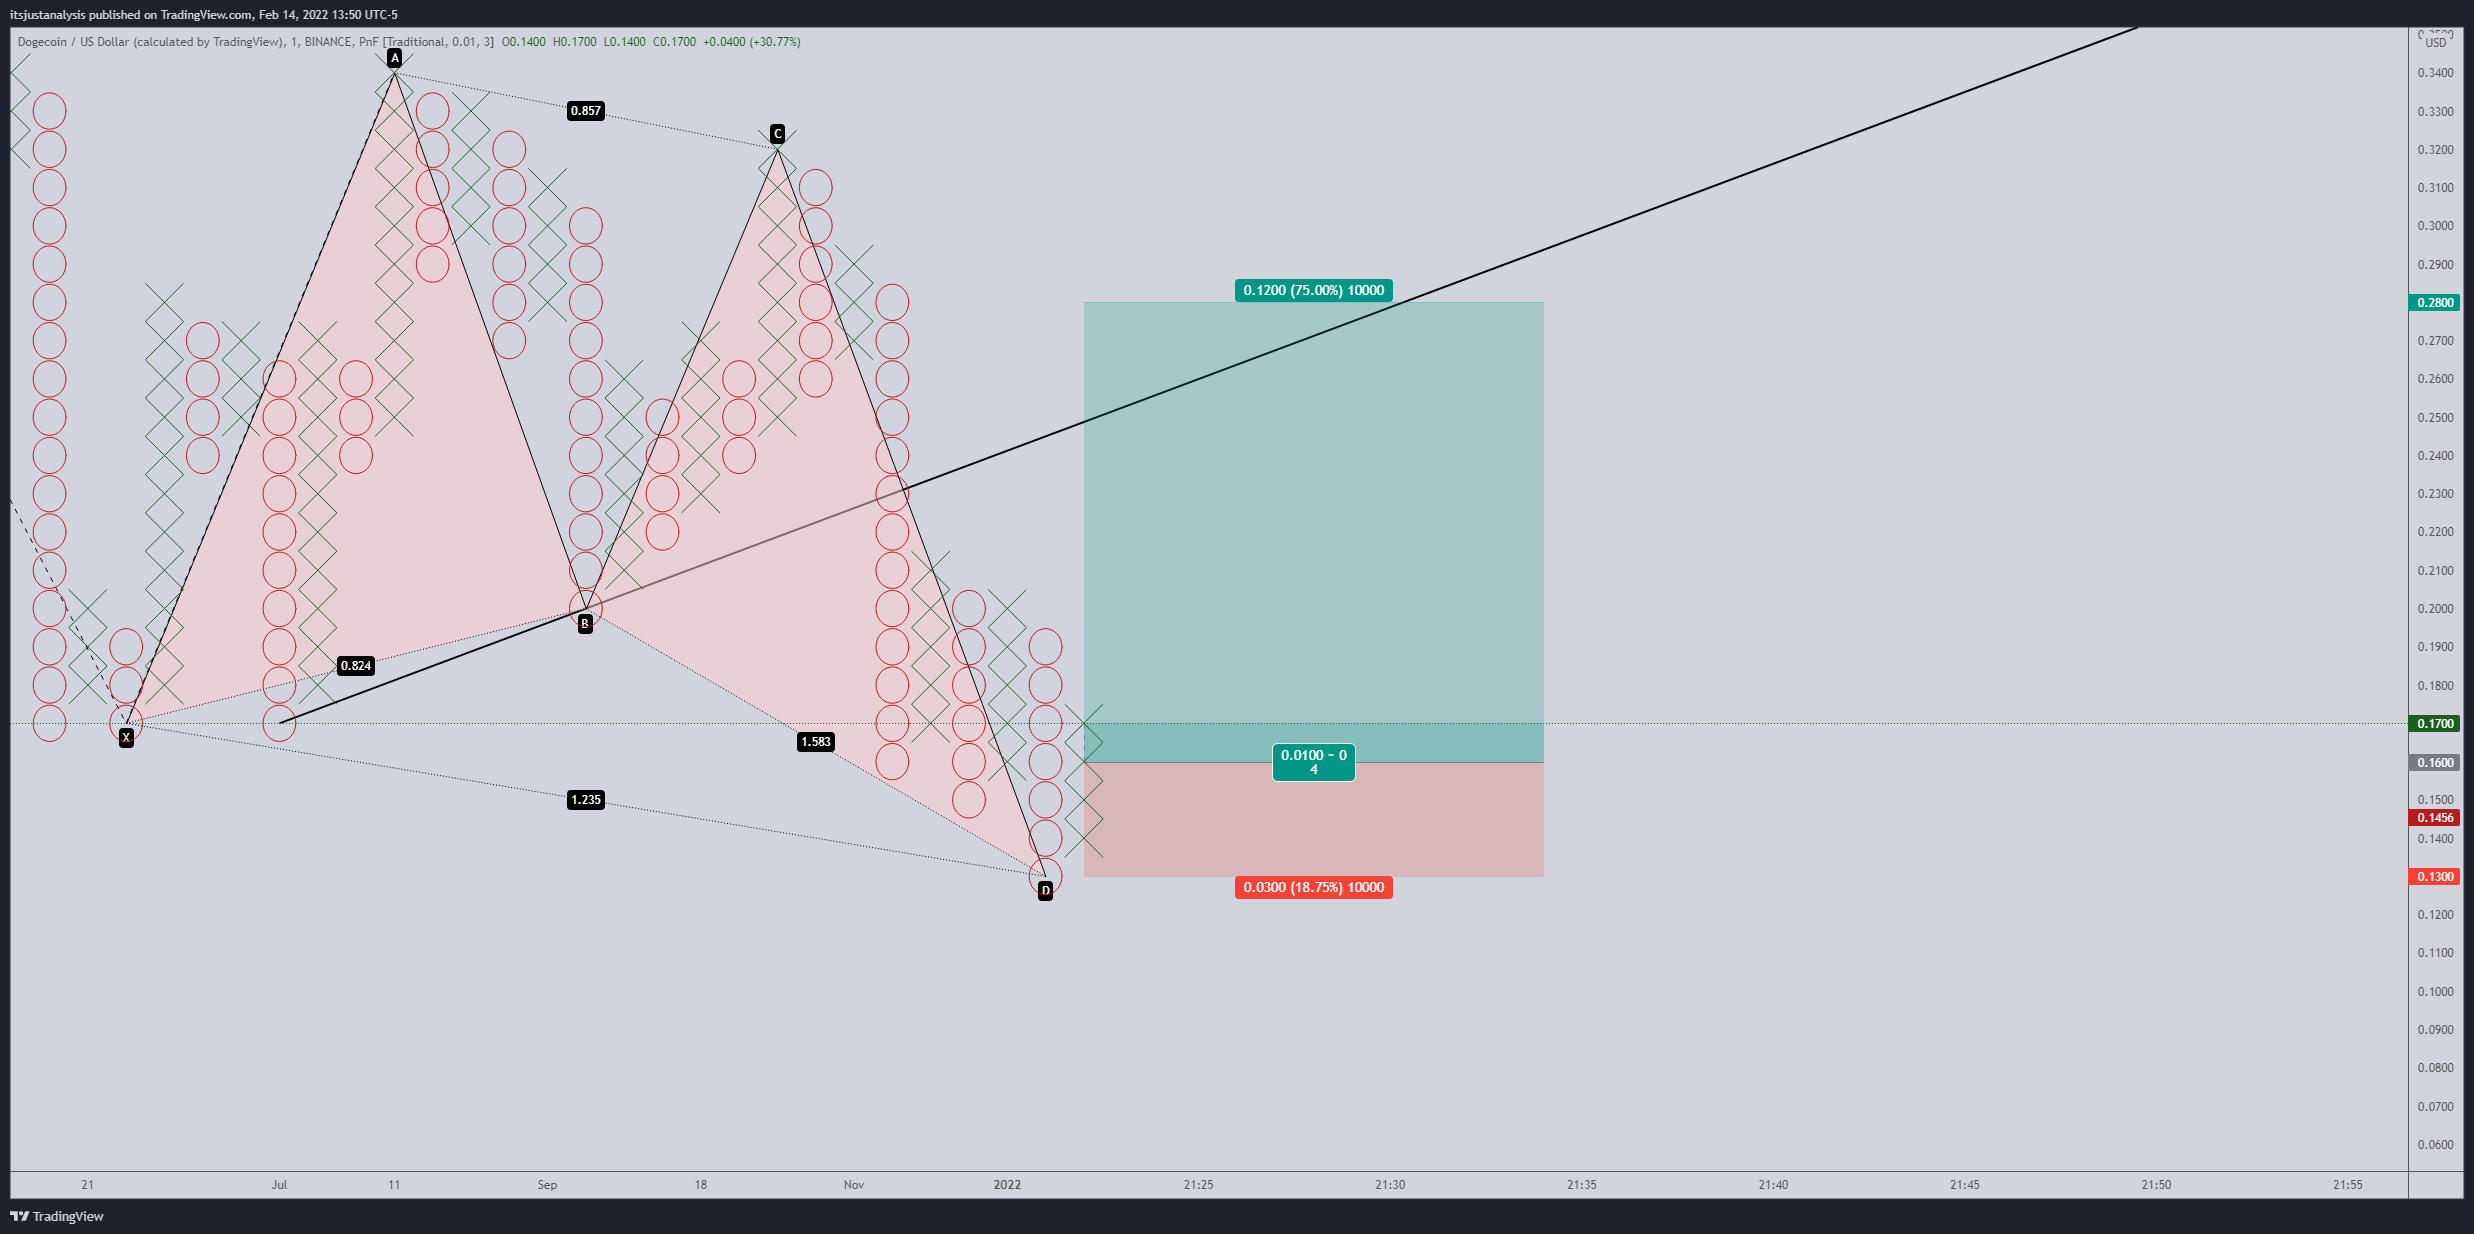
Dogecoin (DOGEUSD) $0.01/3-box Reversal Point and Figure Chart
 Above: Dogecoin (DOGEUSD)
Dogecoin recently completed a bullish Gartley pattern, a pattern identified quite a while ago and still in the process of playing out. The image shows that the buy stop was already triggered; however, Dogecoin is currently trading below that entry, so if you missed it, it is still valid.
The long trade idea is a buy stop order at $0.17, a stop loss at $0.13, and a profit target at $0.28. The profit target is based on the range an instrument will move after hitting the Gartley pattern’s PRZ (Potential Reversal Zone). However, price would likely get halted or stopped temporarily at the prior upper trendline (black diagonal line) and psychological price level of $0.25.
 The trade setup is a 4:1 reward for the risk with an implied profit of 75% from the entry. A two-box trailing stop would help protect any profit made post entry.
Floki Inu (FLOKIUSD) $0.00001/3-box Reversal Point and Figure Chart
 Above: Floki Inu (FLOKIUSD)
Similar to Dogecoin’s chart, the entry on the chart image above shows that the reversal column already occurred. However, Floki Inu is currently trading below that level, so the entry is still open and valid. The trade setup is a buy stop order at $0.000050, a stop loss at $0.000020, and a profit target at $0.000140. The trade represents a 3:1 reward for the risk with an implied profit target of 180% from the entry.
The entry is based on a Spike Pattern in Point and Figure analysis. Violent and rapid reversals typically occur from this pattern, especially if a new extreme or all-time high/low occurred in that pattern. FLOKI has had precisely that kind of situation play out. While no time factor is involved in Point and Figure, it could take several weeks to a few months before price would reach the projected profit target.
This news is republished from another source. You can check the original article here
Be the first to comment