
- Bitcoin price gives back most of its weekend gains to test support.
- Ethereum price returns to critical Fibonacci support.
- XRP price at risk of a return to $0.28.
Bitcoin price falls more than 5% after a massive rally off of new 2022 lows. Ethereum price, like BTC, has given up nearly all of the gains it generated since last Friday. XRP price shows signs that it will be unable to breakout above near-term resistance, signaling another major drop in value may occur.
Bitcoin price see traders parse movement post-weekend rally
Bitcoin price action has pulled back since the Sunday close, moving more than 5% lower on the day. BTC has bounced off the 38.2% Fibonacci retracement near the Saturday (May 14, 2022) open and is so far holding that zone as support.
A result of the pullback of Bitcoin price is a powerful Triple Top Breakout setup on the $500/3-box reversal Point and Figure chart. The hypothetical long entry is a buy stop at $32,000, a stop loss at $29,500, and a profit target at $39,000.
BTC/USD $500/3-box Reversal Point and Figure Chart
The trade represents 3.5:1 rewards for the risk. A two-box trailing stop would help protect any profit generated post entry.
Ethereum price testing a new support range; failure to hold here could trigger another 40% wipe
Ethereum price has lost almost all of its momentum after last Thursday’s sell-off. As ETH approached the daily Tenkan-Sen and 78.6% Fibonacci retracement at $2,161, sellers promptly took over. As a result, today’s session has seen ETH wipe out all of Sunday’s and Saturday’s gains.
However, Ethereum price remains well above the new 2022 lows it established last Thursday at $1,763. The $1,950 level is the final primary support zone on the daily chart for ETH before it could collapse into the next high volume node in the 2021 Volume Profile at $1,250.
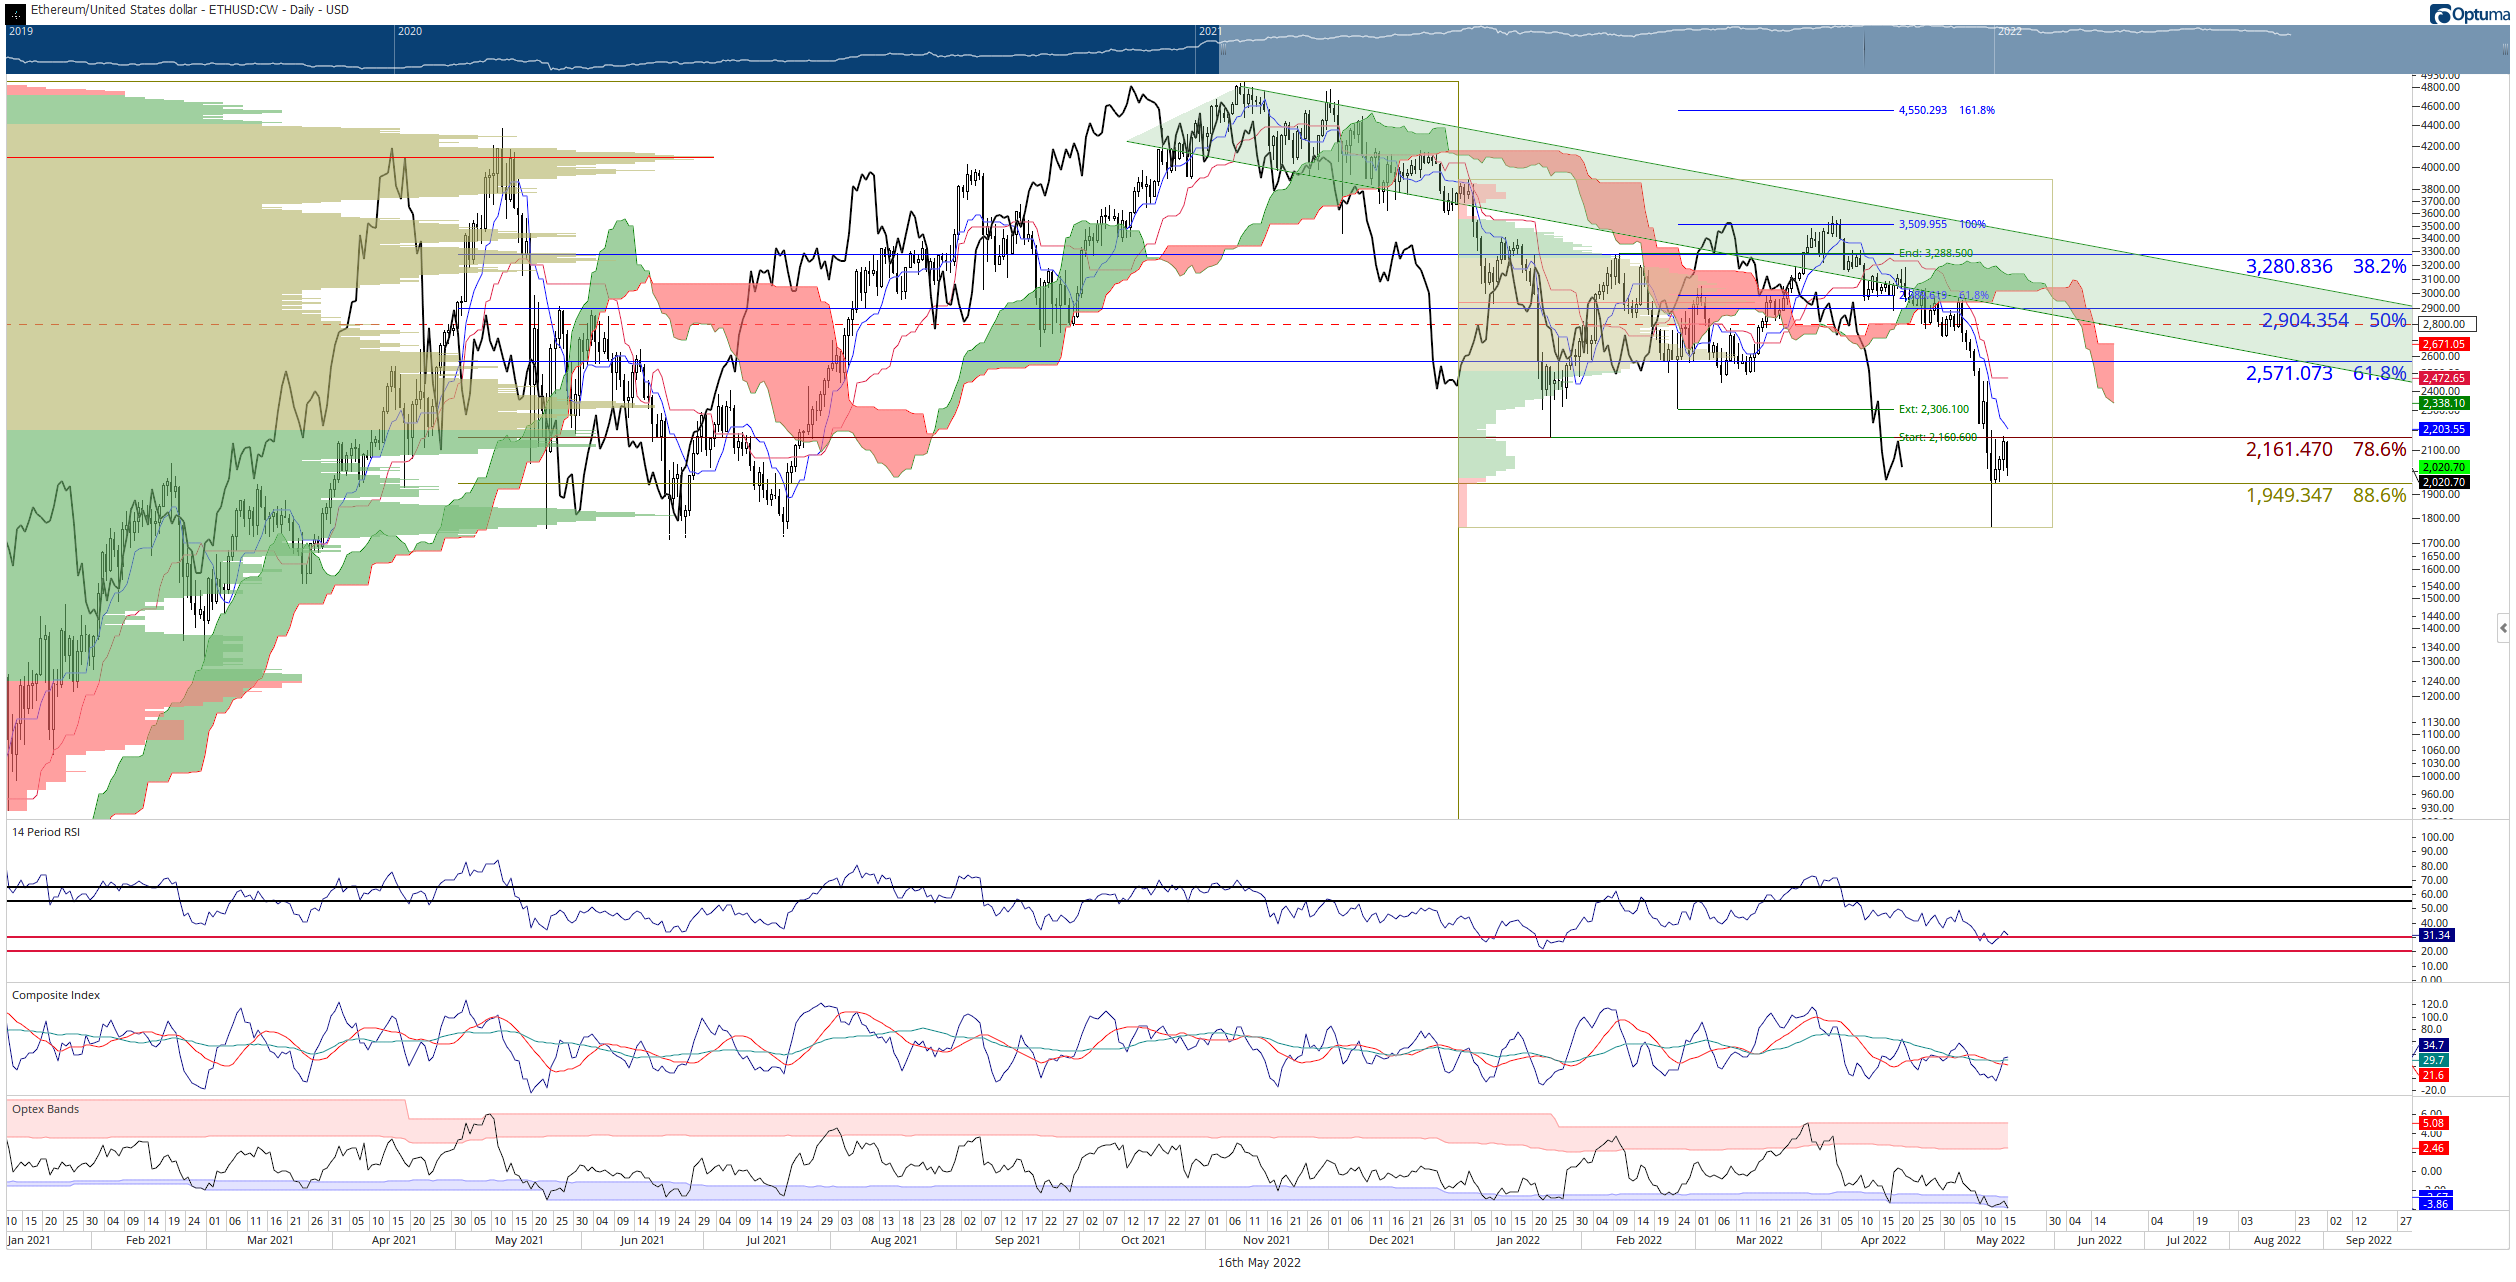
ETH/USD Daily Ichimoku Kinko Hyo Chart
Any upside potential for Ethereum price is likely limited to the $2,500 value area where the daily Kijun-Sen at $2,470 and the 61.8% Fibonacci retracement at $2,571 exist.
XRP price poised for another 40% sell-off
XRP price action does not look promising for bulls. However, from the perspective of the daily Ichimoku chart, There is no near-term support ahead, nor is it out of equilibrium with any of the Ichimoku components.
Bulls have the unenviable job of breaking the most critical resistance zone for XRP until the $1 level: $0.50. The $0.50 value area contains the 61.8% Fibonacci retracement ($0.495), the daily Tenkan-Sen ($0.47), and the 2021 Volume Point of Control ($0.48). As a result, buyers pushed XRP into that range and were immediately met with sellers.
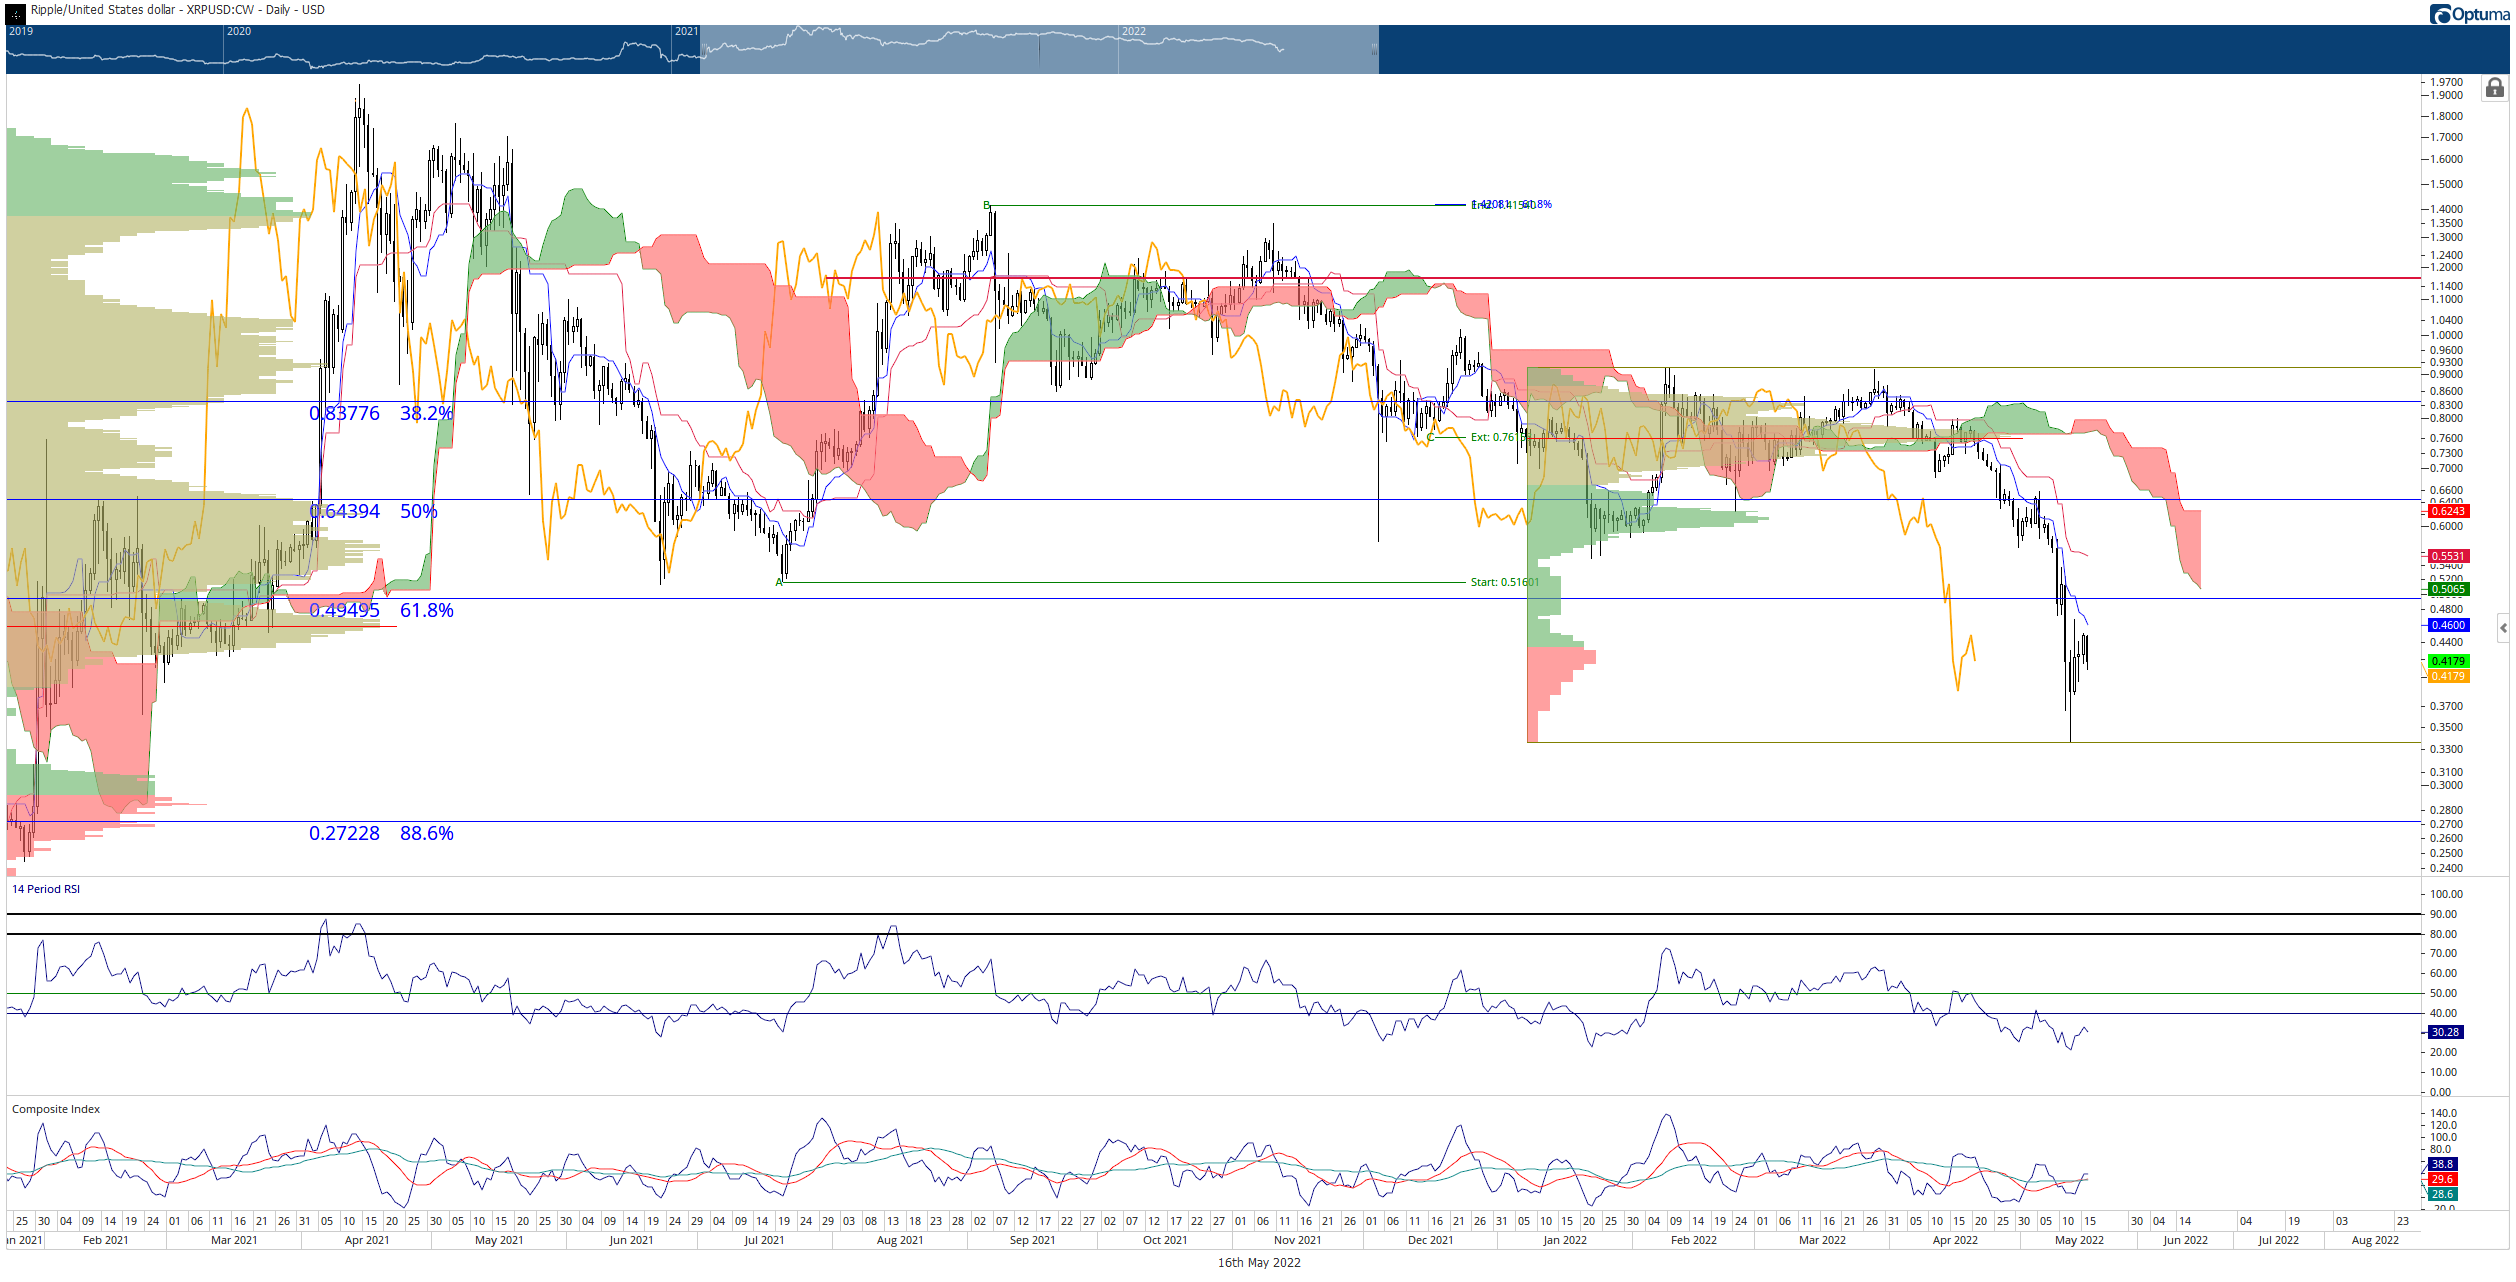
XRP/USDT Daily Ichimoku Kinko Hyo Chart
The real danger for any XRP price holders is between $0.42 and $0.28. There is a very thinly traded zone in the Volume Profile between $0.42 and $0.28. Probably, XRP price may not begin a new uptrend until it falls into the $0.28 value area – which also contains the powerful 88.6% Fibonacci retracement.
The near-term upside potential for XRP price is likely limited to daily Kijun-Sen at $0.55.
This news is republished from another source. You can check the original article here
Be the first to comment