Key Insights:
- It was a bullish Sunday session, with dogecoin (DOGE) and shiba inu (SHIB) joining the broader crypto market in positive territory.
- Network updates took a back seat, with dip buyers returning to deliver much-needed price support.
- However, the technical indicators remain bearish, as hawkish Fed monetary policy bets peg the crypto market cap from any material upswing.
On Sunday, dogecoin (DOGE) rose by 0.59%. Reversing a 0.12% loss from Saturday, DOGE ended the week down 5.14% to $0.05892.
After a choppy morning session, DOGE struck a late high of $0.059485. However, falling short of the First Major Resistance Level (R1) at $0.0596, DOGE slid to a late low of $0.058470. Steering clear of the First Major Support Level (S1) at $0.0578, DOGE bounced back to end the day at $0.05892.
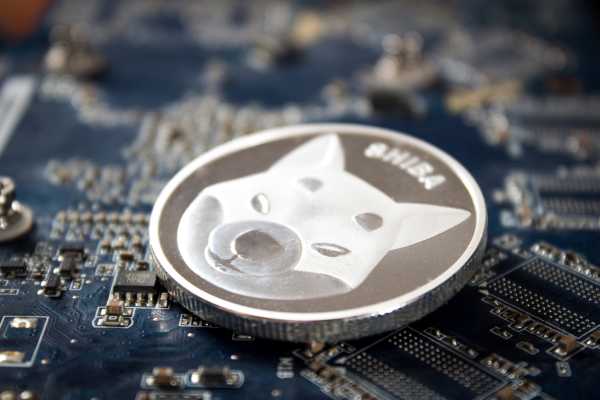
Shiba inu coin (SHIB) rose by 0.59% on Sunday. Following a 0.39% gain on Saturday, SHIB ended the week down 6.79% to $0.00001029.
A bullish start to the day saw SHIB rise to an early morning high of $0.00001039. However, falling short of the First Major Resistance Level (R1) at $0.00001050, SHIB slid to a late afternoon low of $0.00001017. Steering clear of the First Major Support Level (S1) at $0.00000999, SHIB recovered to end the day at $0.00001029.
Fed fear took a back seat on Sunday, with buyers returning from the sidelines. A lack of Fed chatter and external influences supported the Sunday rise ahead of a relatively quiet week on the US economic calendar.
There were also no network updates to provide DOGE and SHIB price action, though news of rising SHIB holders throughout 2022 was price positive. Despite the bearish price trends, the number of SHIB holders sits at 1,224,583, according to CoinMarketCap. While down from a September 25 peak of 1,228,038, the number of holders has been on an upward trend since January.
Dogecoin (DOGE) Price Action
At the time of writing, DOGE was up 0.08% to $0.05897. A choppy start to the day saw DOGE fall to an early low of $0.05855 before rising to a high of $0.05916.
Technical Indicators
DOGE needs to move through the $0.0590 pivot to retarget the First Major Resistance Level (R1) at $0.0594 and the Sunday high of $0.05949. However, crypto news and Fed chatter should be crypto-friendly to support a breakout.
In the case of an extended crypto market rally, DOGE should test the Second Major Resistance Level (R2) at $0.0600. The Third Major Resistance Level (R3) sits at $0.0610.
Failure to move through the pivot would leave the First Major Support Level (S1) at $0.0584 in play. However, barring another crypto sell-off, DOGE should steer clear of sub-$0.0580 and the Second Major Support Level (S2) at $0.0579. Third Major Support Level (S3) at $0.0569
The EMAs sent a bearish signal, with DOGE sitting below the 50-day EMA, currently at $0.05978. The 50-day EMA eased back from the 100-day EMA, with the 100-day EMA falling back from the 200-day EMA. The price signals were bearish.
A move through R1 ($0.0594) would give the bulls a run at the 50-day EMA ($0.05978) and R2 ($0.0600). The 200-day EMA sits at 0.06128. However, failure to move through the 50-day EMA ($0.05978) would leave DOGE under pressure.
Shiba Inu Coin (SHIB) Price Action
At the time of writing, SHIB was down 0.19% to $0.00001027. A choppy start to the day saw SHIB fall to an early low of $0.00001021 before climbing to a high of $0.00001033.
Technical Indicators
SHIB needs to move through the $0.00001028 pivot to target the First Major Resistance Level (R1) at $0.00001040. SHIB would need support from the broader market and cautious FOMC member chatter to deliver a bullish session.
A broad-based crypto rally would see SHIB test the Second Major Resistance Level (R2) at $0.00001050. The Third Major Resistance Level (R3) sits at $0.00001072.
Failure to move through the pivot would leave the First Major Support Level (S1) at $0.00001018 in play. Barring an extended sell-off, SHIB should avoid sub-$0.0000100. The Second Major Support Level (S2) at $0.000001006 should limit the downside.
The Third Major Support Level (S3) sits at $0.00000984.
The EMAs send a bearish signal, with SHIB sitting below the 50-day EMA, currently at $0.00001042. This morning, the 50-day EMA eased back from the 100-day EMA, with the 100-day EMA falling back from the 200-day EMA. The signals were bearish.
A move through R1 ($0.00001040) and the 50-day EMA ($0.00001042) would give the bulls a run at R2 ($0.00001050). However, failure to move through the 50-day EMA ($0.00001042) would leave S1 ($0.00001018) in view.
This news is republished from another source. You can check the original article here

Be the first to comment