
This week, we take a closer look at Ethereum, Ripple, Cardano, Solana, and Tron.
Ethereum (ETH)
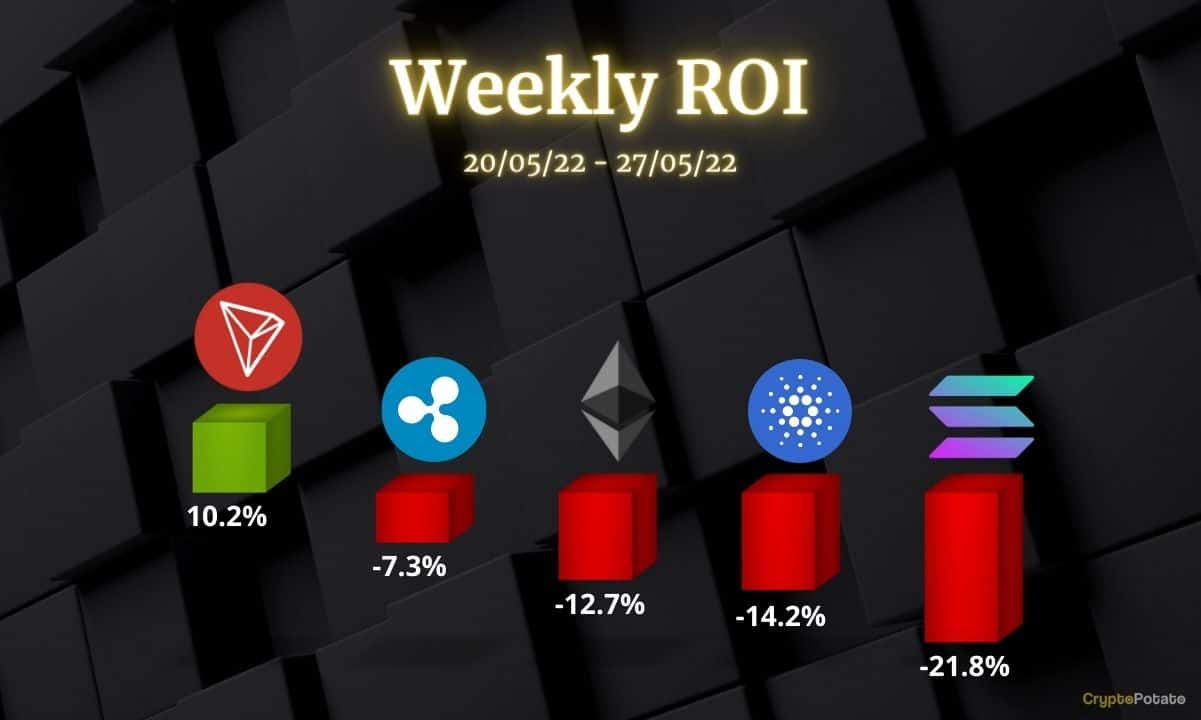
During a sustained sell-off yesterday, Ethereum lost the critical support level at $1,900, and its price fell to $1,700. This evaporated hopes of a quick recovery and turned market sentiment extremely bearish. ETH has lost 12.7% in the past seven days.
There is only one relatively good thing about the market right now – volume during this latest drop in price has been lower than on May 12th. This could signal that sellers are approaching an exhaustion point. Moreso, as long as the selling volume fails to pick up again, the daily RSI could form a bullish divergence.
ETH has had a very difficult time lately with eight consecutive weekly candles in red. To stop this downtrend, the cryptocurrency must hold above the $1,700 support level. Otherwise, bears could take the price much lower. If that happens, the next key support level will be found at $1,450, which was the previous all-time high from January 2018.

Ripple (XRP)
XRP had a better week compared to Ethereum since its key support level at $0.38 has held well during the sell-off from yesterday. Nevertheless, it also fell by 7.3% in the past seven days and continues to be very close to the key support.
The price action right now could be interpreted as a double bottom should the market stop the correction around current levels. If this plays out, XRP could see a quick recovery towards the key resistance at $0.56. While it is too early to expect that, the market has not had a relief rally in over two months, and sentiment could shift unexpectedly.
As long as the key support at $0.38 continues to hold, then XRP can hope for a bullish relief in the coming month. The daily RSI indicator is also making higher lows which is an early signal that we could see a stop to the downtrend in the future.

Cardano (ADA)
Cardano’s situation is very similar to Ethereum, with its price falling below the key support at $0.50. This has turned the bias bearish, and the next support is found at $0.39. For this reason, ADA had a difficult week, closing the past seven days in the red with a 14.2% loss.
In the coming days, the cryptocurrency might fall lower before attempting a recovery. Buyers seem less likely to come to the rescue at present, particularly when the key support level is much lower than the current price.
Looking ahead, ADA has to do its best to not close a daily candle below $0.39. This was the all-time high from May 2018 and was also confirmed in January 2021 before ADA rallied towards $3. A loss of this critical level would take ADA into a severe correction exceeding a 90% price drop from its current all-time high.

Solana (SOL)
Solana did not manage to stop the downtrend yesterday, and the price fell below the important support at $44. The cryptocurrency is on a path to re-test the critical level at $37. SOL has lost 21.8% of its valuation in the past seven days, making it the worst performer on our list.
The downtrend is clear for Solana, and buyers appear hard to find as the price falls. This is also shown by the daily RSI indicator, which has fallen again to 30 points and may soon re-enter the oversold area.
Looking ahead, SOL really needs the overall market sentiment to change and turn bullish. Otherwise, it is very hard to expect its price to recover from the recent losses. There is simply no demand at this time that can hold it from falling lower.

Tron (TRX)
With bullish fundamentals, TRX is the best performer on our list this week, increasing by 10.2%. Considering the current market, it is quite a feat to close in the green on the weekly timeframe. The magic that keeps Tron going up is the USDD stablecoin which has similarities to UST, which recently collapsed.
To mint USDD, TRX needs to be burnt. This has created a positive feedback loop on TRX price. Moreover, the Terra / Luna / UST ecosystem crash has left many investors looking for a new home, and Tron may appear as an alternative. The price action confirms this as TRX has formed a parabola on the daily timeframe.
The next key resistance level for TRX is $0.10. The last time its price approached this level, sellers came in strong, and they may do the same if the overall market remains bearish. Nevertheless, if the cryptocurrency continues to test this key resistance, it should eventually be broken.

Binance Free $100 (Exclusive): Use this link to register and receive $100 free and 10% off fees on Binance Futures first month (terms).
PrimeXBT Special Offer: Use this link to register & enter POTATO50 code to receive up to $7,000 on your deposits.
Disclaimer: Information found on CryptoPotato is those of writers quoted. It does not represent the opinions of CryptoPotato on whether to buy, sell, or hold any investments. You are advised to conduct your own research before making any investment decisions. Use provided information at your own risk. See Disclaimer for more information.
Cryptocurrency charts by TradingView.
This news is republished from another source. You can check the original article here
Be the first to comment