The below is an excerpt from a recent edition of Bitcoin Magazine Pro, Bitcoin Magazine’s premium markets newsletter. To be among the first to receive these insights and other on-chain bitcoin market analysis straight to your inbox, subscribe now.
Shiller P/E Ratio
Much of our commentary since the start of Bitcoin Magazine Pro has been in regards to the relationship between bitcoin and equities, and their reflection of the global “liquidity tide.” As we have previously discussed, given that the size of the bitcoin market relative to that of U.S. equities is minuscule (the current market capitalization of U.S. equities is approximately $41.5 trillion, compared to $452 billion for bitcoin). Given the trending market correlation between the two, it’s useful to ask just how over/undervalued equities are relative to historical values.
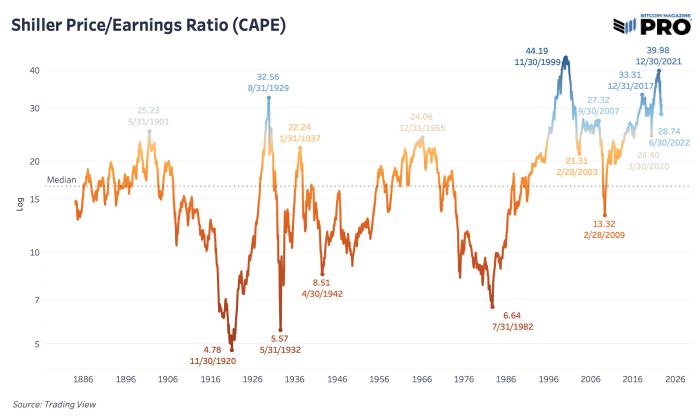
One of the best ways to analyze when the broader equities market is overvalued is the Shiller price-per-earnings (PE) ratio. Also known as cyclically-adjusted PE ratio (CAPE), the metric is based on inflation-adjusted earnings from the last 10 years. Through decades of histories and cycles, it’s been key at showing when prices in the market are far overvalued or undervalued relative to history. The median value of 16.60 over the last 140-plus years shows that prices relative to earnings always find a way to revert back. For equity investing, where return on investment is necessarily dependent on future earnings, the price you pay for said earnings is of utmost importance.
We find ourselves in one of the unique points in history where valuations have soared just shy of their 1999 highs and the “everything bubble” has started to show signs of bursting. Yet, by all comparisons to previous bubbles bursting, we’re only eight months down this path. Despite the rally we’ve seen over the last few months and the explosive inflation surprise upside move that came today, this is a signal of the broader market picture that’s hard to ignore.
Even though the release of Consumer Price Index data came in at a surprising 0.0% reading month over month, year-over-year inflation is at an unpalatable 8.7% in the United States. Even if inflation were to completely abate for the rest of the year, 2022 would still have experienced over 6% inflation during the course of the year. The key here being that the cost of capital (Treasury yields) are in the process of adjusting to this new world, with inflation being the highest felt over the last 40 years, yields have risen in record fashion and have pulled down the multiples in equities as a result.
If we think of the potential paths going forward, with inflation being fought by the Federal Reserve with tighter policy, there is the potential for stagflation in terms of negative real growth, while the labor market turns over.
Looking at the relative valuation levels of U.S. equities during previous periods of high inflation and/or sustained financial repression, it is clear that equities are still near priced to perfection in real terms (inflation-adjusted 10-year earnings). As we believe that sustained financial repression is an absolute necessity as long as debt remains above productivity levels (U.S. public debt-to-GDP > 100%), equities still look quite expensive in real terms.
Either U.S. equity valuations are no longer tied to reality (unlikely), or:
- U.S. equity markets crash in nominal terms to lower multiples relative to the historic mean/median
- U.S. equities melt up in nominal terms due to a sustained high inflation, yet fall in real terms, thus bleeding investor purchasing power
The conclusion is that global investors will likely increasingly search for an asset to park their purchasing power that can escape both the negative real yields present in the fixed income market and the high earnings multiples (and subsequently low or negative real equity yields).
In a world where both bond and equity yields are lower than the annual rate inflation, where do investors park their wealth, and what do they use to conduct economic calculation?
Our answer over the long term is simple, just check the name of our publication.
This news is republished from another source. You can check the original article here


Be the first to comment