

Have you ever wondered what a pool’s Annual Percentage Rate (APR) was yesterday, one week ago, two months ago? Or perhaps you wondered what a pool’s average APR was for the past week, month, year? How about getting annoyed that you have to visit twenty different apps to find the best APR for a certain asset, app, or platform? Maybe you are just frustrated that there are too many platforms, with too many apps and assets on them, and making the best investment decision seems impossible? Enter DeFi Watch.
What You’ll Learn
- How to explore full historical data for various DeFi apps such as Aave, Compound, Uniswap, and more
- How to use filters to find exactly what you are looking for
- How to read the data for individual pools to make better DeFi investment decisions
- Common decentralized finance terminology
- The methodology and data sources we use to collect blockchain data, analyze it, and build our historical DeFi archive
DeFi Historical Data on DeFi Watch
Open The Chain Bulletin’s DeFi Watch and wait for the data to load:

As you can see we have two tables — one for lending pools and one for liquidity pools. Lending pools are pools that have both depositors and borrowers, while liquidity pools only allow deposits. The former appear on apps such as Compound and Aave, while the latter are children of Bancor, Uniswap, and other automated market makers.
Terminology
- TVL — Total Value Locked in the pool (in USD), i.e., the sum of the USD value of all assets in the pool.
- BAPR — Borrow Annual Percentage Rate is the yearly interest paid on borrows from a pool, e.g., if you borrow 100 ETH from the Compound ETH pool at 1% BAPR, you will have to return 101 ETH to close the position after a year.
- DAPR — Deposit Annual Percentage rate is the yearly interest paid on deposits, e.g., if you deposit $100 in the WBTC-WETH pool on Uniswap V3 at 10% DAPR, you will have earned $10 by the end of the year.
- IL — Impermanent Loss, i.e., the difference between holding an asset and depositing it into a liquidity pool (learn more about IL here).
- Utilization — the percentage of deposits in a pool that has been borrowed, e.g., if there is 100 ETH in the Compound ETH pool and 50 are borrowed, the utilization is 50%. The more utilization a pool has the more interest is paid by borrowers and subsequently paid to depositors.
Periods
As you can see, some of the columns have period buttons next to the title. This means that the numbers (and charts) shown for the column are relevant to that period. For example, if you choose a 1 month period for the Volume/Fees column you will see how much total trading volume (and fees) the pools have generated for that period. However, if you choose the 1 month period for the DAPR column you will see the average DAPR for that period. DeFi Watch currently supports the following periods:
- 24 hours
- 7 days
- 1 month
- 3 months
- 6 months
- 1 year
- All
Data Sources
Price and meta data for assets comes from CoinGecko’s API.
Data for pools comes directly from the blockchain as APIs do not offer full historical data and have the tendency to go down at times. Thus we run our own blockchain archive nodes. For our Ethereum node we make use of Erigon to make things easier, and we are working on establishing nodes for other blockchains as well — Avalanche, BSC, Fantom, etc — as implementations of Erigon are developed for each of these platforms.
Methodology
For each app supported on DeFi Watch we analyze their documentation and integrate with their smart contracts to pull full historical data from the blockchain.
Let’s take Uniswap V2. Being the second iteration of the most popular decentralized exchange (dex), Uniswap V2 has a familiar smart contract architecture:
- A factory contract is the main entry point to the app
- A swap event is emitted on each trade
The get full historical data for Uniswap V2 we need to do two things: one, find all pools listed one the app; two, get the entire trading volume each pool has generated.
To complete the first task we open the factory contract and we get the allPairsLength variable — that’s the number of pools listed on the app. We then call the allPairs method for each index in allPairsLength to get the address of each pool. For example, the first pool that was listed on Uniswap V2 (index 0) is USDC-WETH.
Once we have the pool address, we can open the pool contract and get the details we need to list the pool, that is, asset addresses via the token0 and token1 variables. Once we have the addresses of the two assets in the pool, we get the data we need for each one from their smart contracts — name, symbol, and decimals. At this point, we have everything we need to list the pool on DeFi Watch.
To get historical data for each pool on Uniswap V2 we need to get the entire trading volume generated by the app as well as the TVL each pool had at specific points in time. We get the trading volume by getting all Swap events from the blockchain, mapping them to each pool based on the address parameter. We get the TVL by calling the getReserves method of the pool, which returns reserve0 and reserve1, the balances for token0 and token1 at a certain point in time.
Once we have the entire trading volume and TVL for each pool we can calculate historical DAPR for whatever period we want. For example, to calculate the DAPR for a single day, we get all the trading volume from that day, get the fees from the volume, and we annualize it by multiplying by 365. We divide the result by the TVL for that day to get the DAPR:
dapr = (fees * a) /tvl
\
where
\
a space is space a space multiplier space such space that space fees space is space annualized
We perform a variant of this process for each app we integrate into DeFi Watch, getting the necessary smart contract data based on app documentation and applying app formulae to get full historical data.
How to Use DeFi Watch
Let’s say that you are holding 1,000 DAI and you want to find the best pool to deposit and earn interest. Using DeFi Watch this task becomes a child’s play. First we search for and select DAI:

We then put a minimum TVL limit of $10,000 to filter out really small pools:

We click Apply Filters and wait a moment for the results:

We now see all pools (on supported apps) that contain DAI and have more than $10,000 TVL. To make things even easier we can sort the results by DAPR to find the highest return rate for a selected period. Let’s say that we want to see the highest DAPR for the past week. All we do is click on the DAPR column:
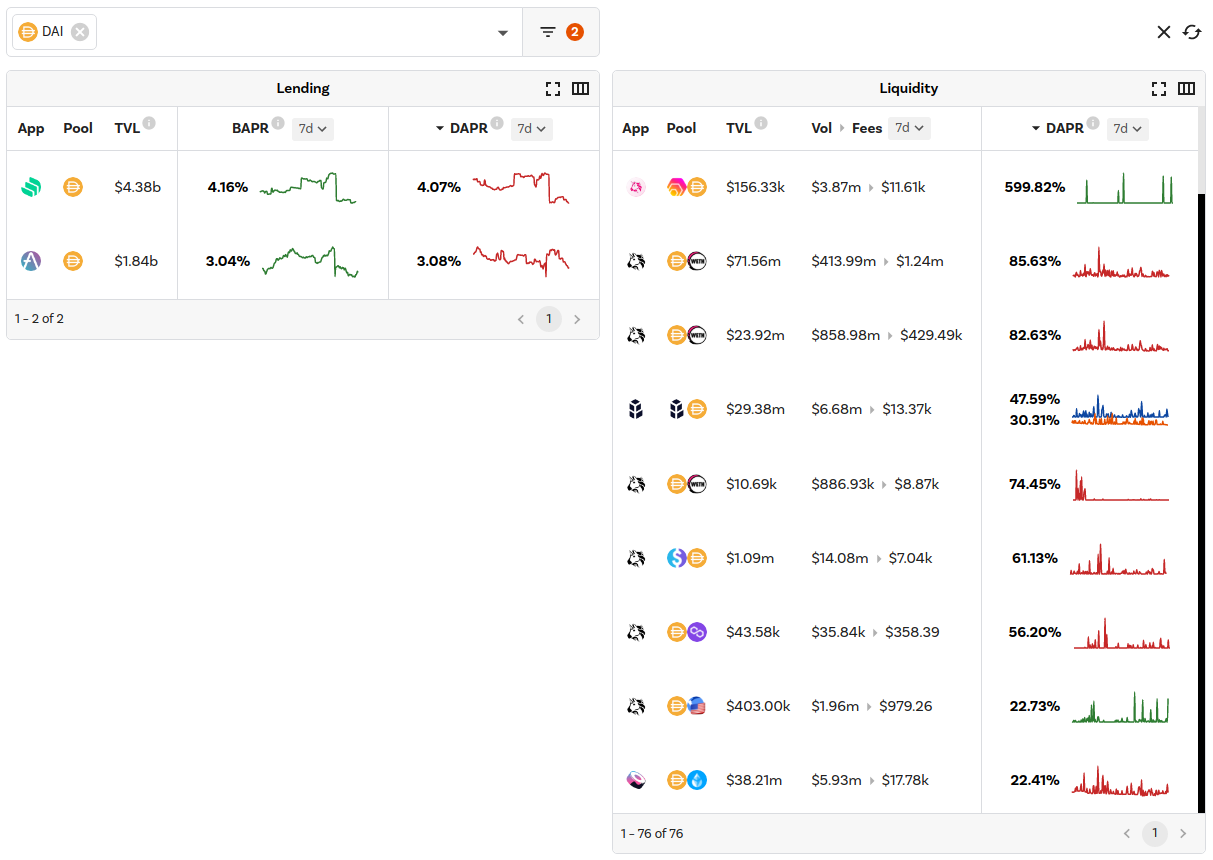
And now, after just a few clicks, we have a list of the best DeFi pools that contain DAI. At this point, we can move into individual pool analysis, taking into consideration asset prices, impermanent loss, the trend of the pool, and all other data available at our disposal.
To continue our example let’s take a closer look at the DAI-WETH Uniswap V3 pool with 0.05% fee:
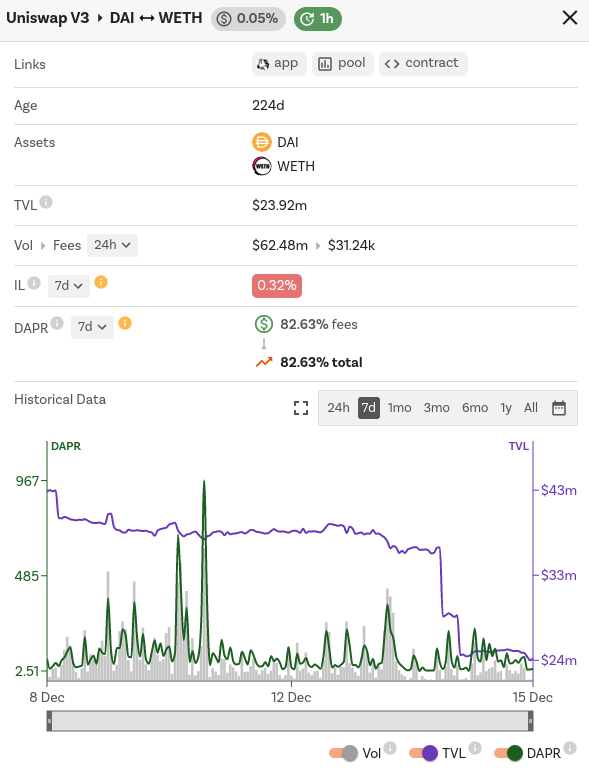
From each pool’s individual page we can interpret crucial details to help us decide whether we want to join the pool or not. For example, a simplest calculation would be to compare the DAPR and IL for the same period; if IL is more than the DAPR, then the pool is not worth it.
Moreover, we can determine the trend of the pool, i.e., the direction it is headed, by checking the DAPR for different periods of time, as well as analyzing the historical data chart, preferably in full screen:

Since there is a lot of data for each pool, we make use of tooltips to show the finer details. For example, hovering over an asset name will show the current price of the asset and a seven day price chart, as well as the percentage change for that period; hovering over the TVL will show the amount of each token in the pool; hovering over the fees will show the amount collected in each asset.
This example portrays one simple way you can use DeFi Watch to make better DeFi investments, but there’s a lot more to the tool:
- You can scroll through table pages, marveling at the diversity of apps, pools, and assets
- You can follow new pool and asset listings to discover gem pools in their infancy
- You can filter by platforms, apps, a multitude of assets, filter by DAPR, TVL, and creation date
- You can analyze your favorite pools by the most crucial metrics, comparing their historical performance to other prospects
In short, DeFi Watch helps you earn more from DeFi.
Summary
DeFi Watch is a decentralized finance historical data aggregator. It allows you to explore and analyze pool prospects on different platforms and apps to find the best place to earn interest on your cryptocurrency holdings.
This news is republished from another source. You can check the original article here
Be the first to comment