- Bitcoin price is under a cloud of uncertainty as history could repeat itself for Bitcoin.
- Ethereum price at the mercy of the Bitcoin Futures ETF catalyst.
- XRP price continues to face fundamental uncertainty with the SEC and technical weakness.
Bitcoin price has historically sold off during the opening of any new derivative futures contract. Will this behavior continue? Ethereum price struggles to cross above the critical $4,000 level and may be held back pending any Bitcoin weakness. XRP price remains in a technical bear flag but is approaching a key time cycle that could trigger explosive price action.
Bitcoin price has its first Futures ETF approved by the U.S. SEC
Bitcoin price has risen significantly since the beginning of October – but can it continue? The Tuesday trade session is the first day of the first Bitcoin futures ETF (NYSE ticker: BITO) to be approved by the SEC. The ETF approval is a strong signal that Bitcoin is just one step closer to becoming a more legitimized asset class and one step closer to an actual spot-priced ETF approval in the future.
BTC/USD Daily Ichimoku Chart
History, as they say, repeats itself. Every prominent derivative listing for Bitcoin, starting with the CBOT futures contract, the CME futures contract, and the Bakkt futures contract, resulted in solid selling pressure for Bitcoin price. Traders and investors are looking out for this kind of behavior to continue. Any sign of weakness or close near $60,000 could trigger some swift selling pressure for Bitcoin.
Ethereum price maintains near-term support, awaits Bitcoin’s move
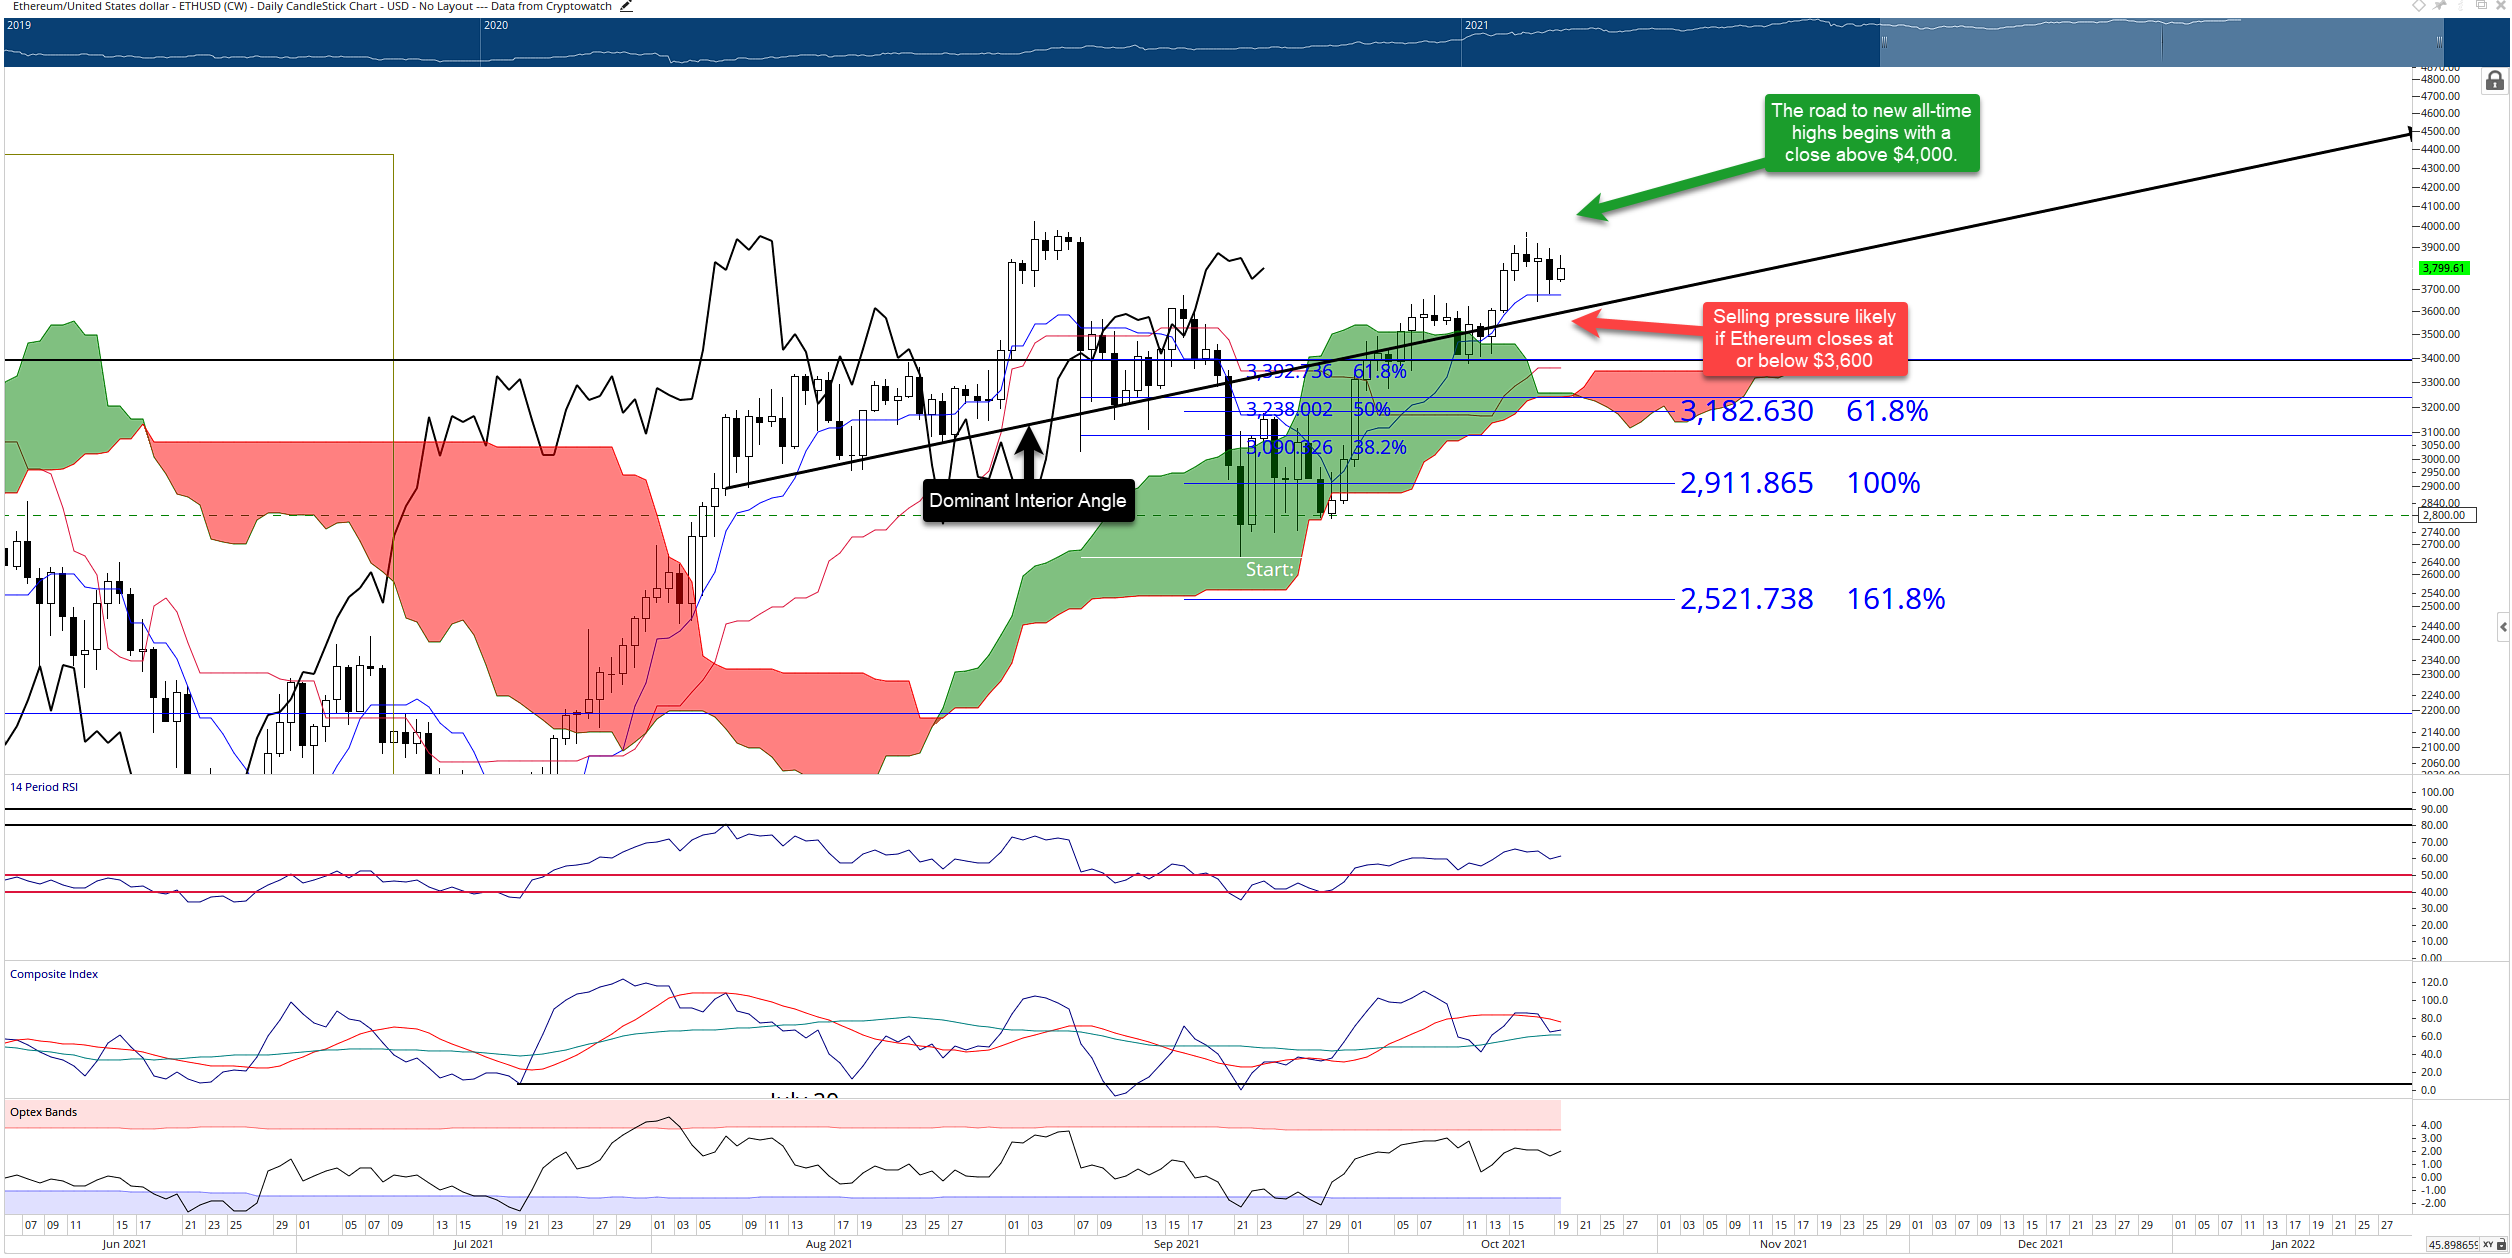
Ethereum price continues to consolidate after hitting the $4,000 value area on October 16th. The Tenkan-Sen at $3,700 has been tested considerably over the past two trading days and continues to hold as support. Ethereum has a vested interest in Bitcoin maintaining or exceeding its current valuation, as the direction will likely dictate where Ethereum will go. Bulls look for a close at or above $4,000 to push towards new all-time highs.

ETH/USD Daily Ichimoku Chart
However, any move below the dominant interior trendline (black diagonal line) could trigger short-selling pressure. Given the strong trend higher, traders will want to watch Ethereum price on October 20th – the date of the next Kumo Twist in the Ichimoku Kinko Hyo system. Kumo Twists are often catalysts for corrective moves or broad trend changes, specifically when an instrument has been trending strongly near the date of the Kumo Twist. A close below $3,600 could trigger a move to test $3,000 as support.
XRP price continues to look weak, Ripple under threat of a sell-off
XRP price had a particularly bullish fundamental event: Fox Business’s Charlie Gasparino interviewed Ripple CEO, Brad Garlinghouse. Garlinghouse focused primarily on the ongoing legal drama with the SEC, but his overall tone was positive and resolute. Unfortunately, however, XRP failed to entice any positive response or price action. There was almost no response by buyers.

XRP/USD Daily Ichimoku Chart
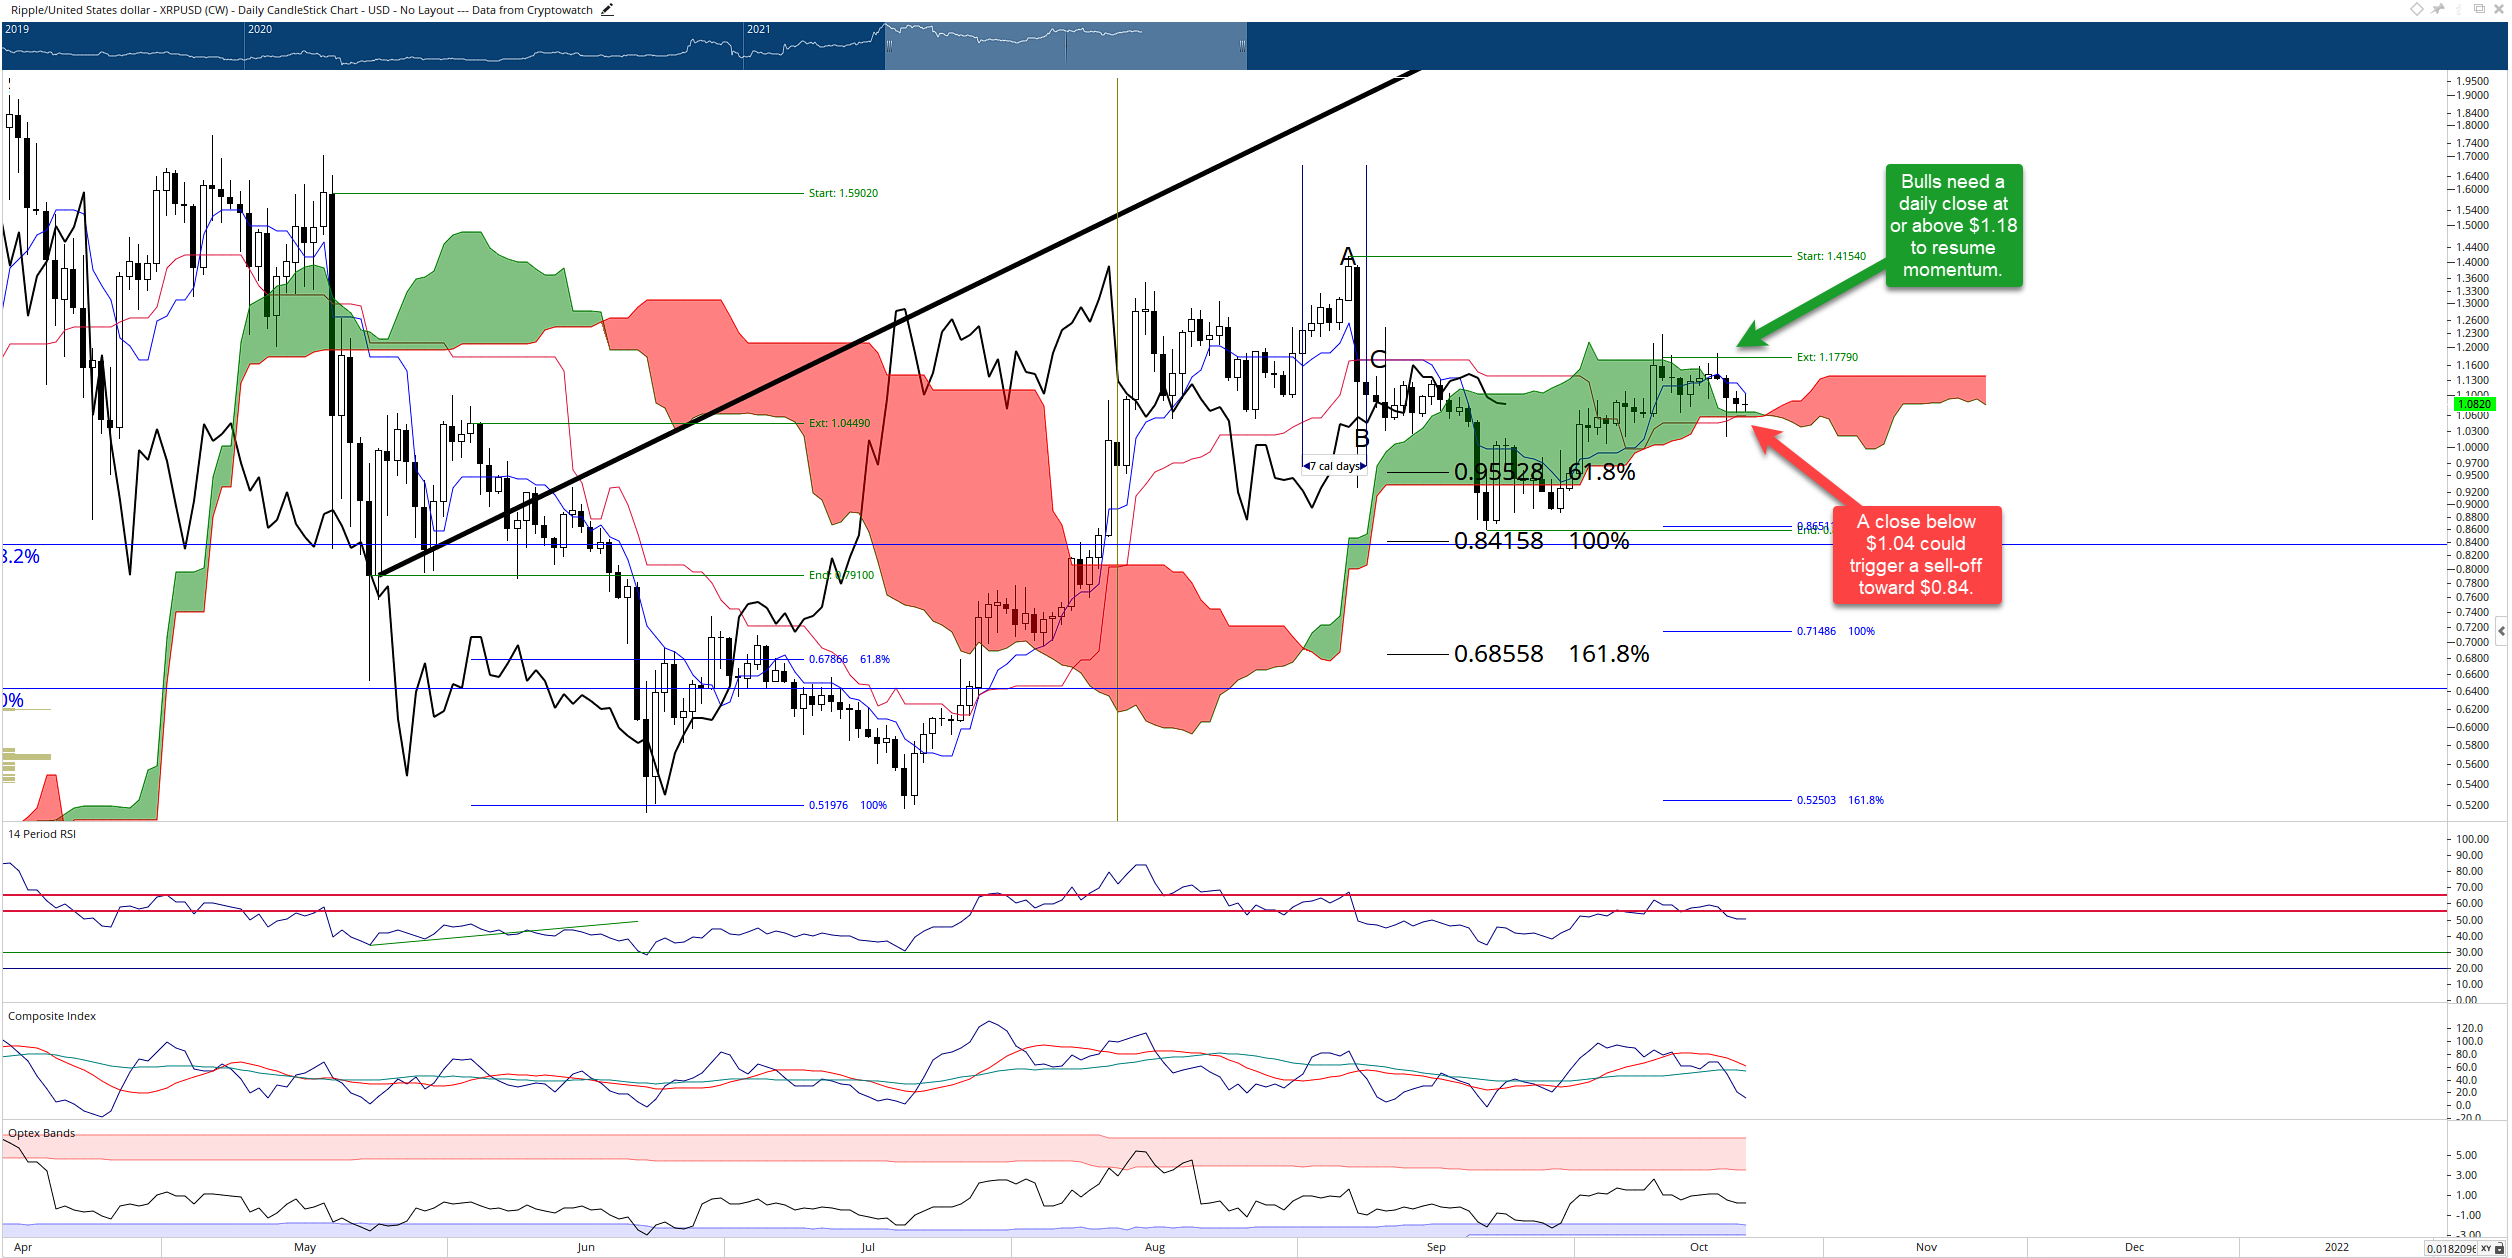
Current technical conditions warn of an impending sell-off. XRP price has one final support zone within the Ichimoku system at $1.05. $1.05 is where the Kijun-Sen, Senkou Span A and Senkou Span B have a shared value area. A close at or below $1.04 would put XRP below the Cloud and all other Ichimoku support levels. Bears are likely to take over in that event and push towards the prior support zone near $0.84.
If bulls desire to take control of the market, then XRP price needs to close above $1.18 before it can make new all-time highs.
This news is republished from another source. You can check the original article here

Be the first to comment