
IOTA (MIOTA) has reclaimed the $1.05 support area. However, it is still following a descending resistance line.
Near Protocol (NEAR) is following an ascending support line and has bounced at the $2.70 horizontal support area.
COTI Network (COTI) is trading inside a descending parallel channel and is attempting to reclaim the $0.245 resistance area.
MIOTA
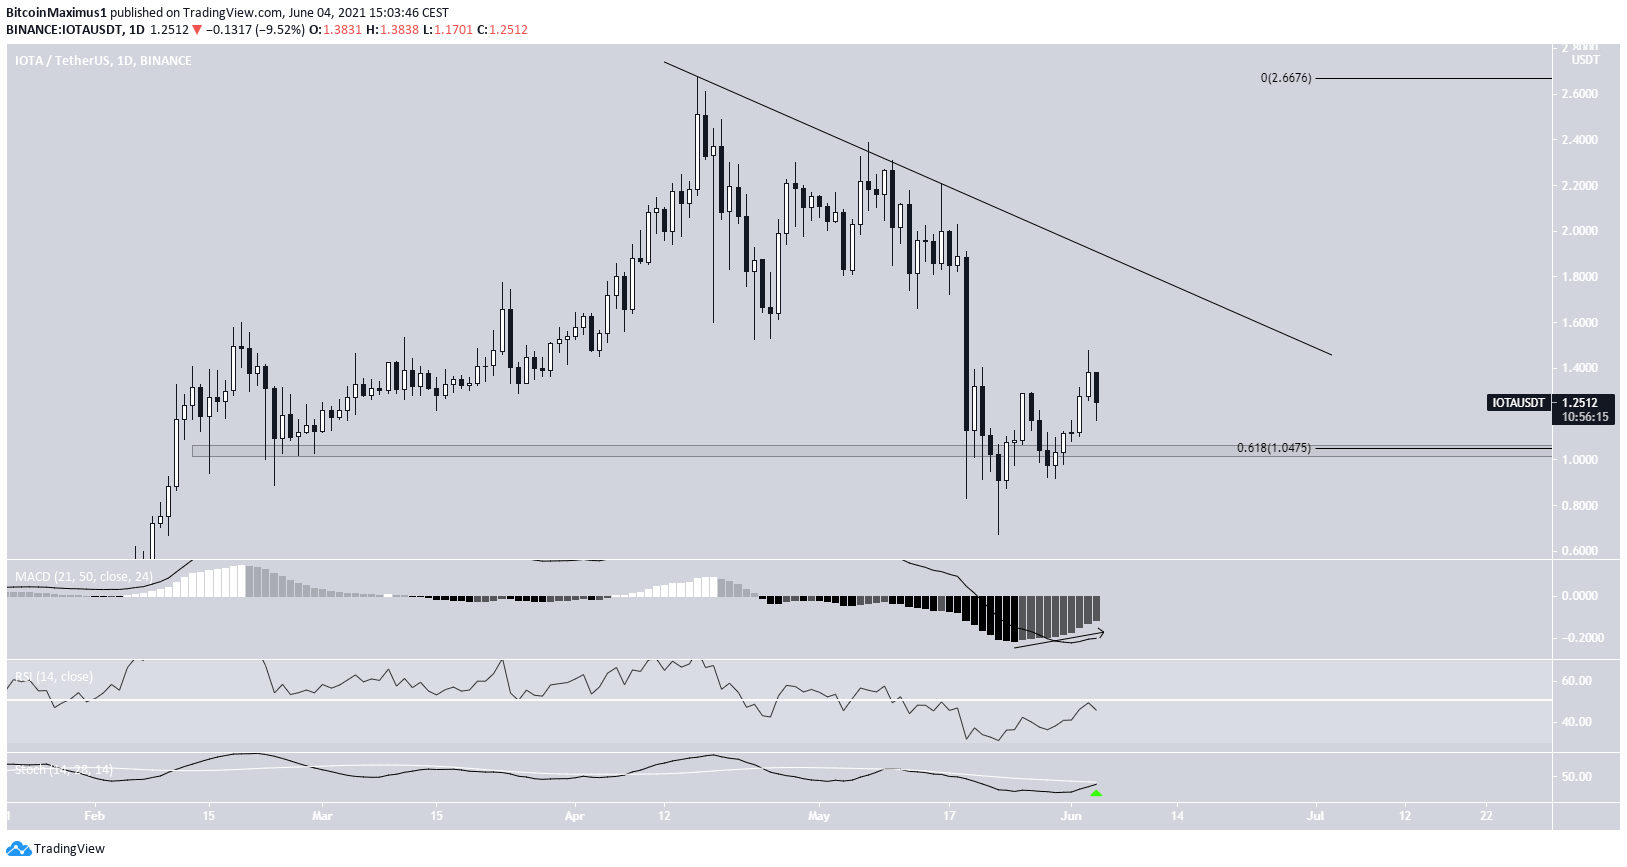
MIOTA has been decreasing since reaching a high of $2.74, on April 16. After creating a lower high on May 7, it resumed the decrease at an accelerated rate, leading to a low of $0.74, on May 19.
However, it bounced immediately afterwards, reclaiming the $1.05 horizontal support area. Despite being a horizontal support area, it is the 0.618 Fib retracement support level.
Technical indicators are providing bullish signs. The MACD and RSI are both increasing, even though the former is not yet positive and the latter is below 50. However, the Stochastic oscillator has already made a bullish cross.
Furthermore, the long-term chart suggests that this could very well be a fourth wave pullback.
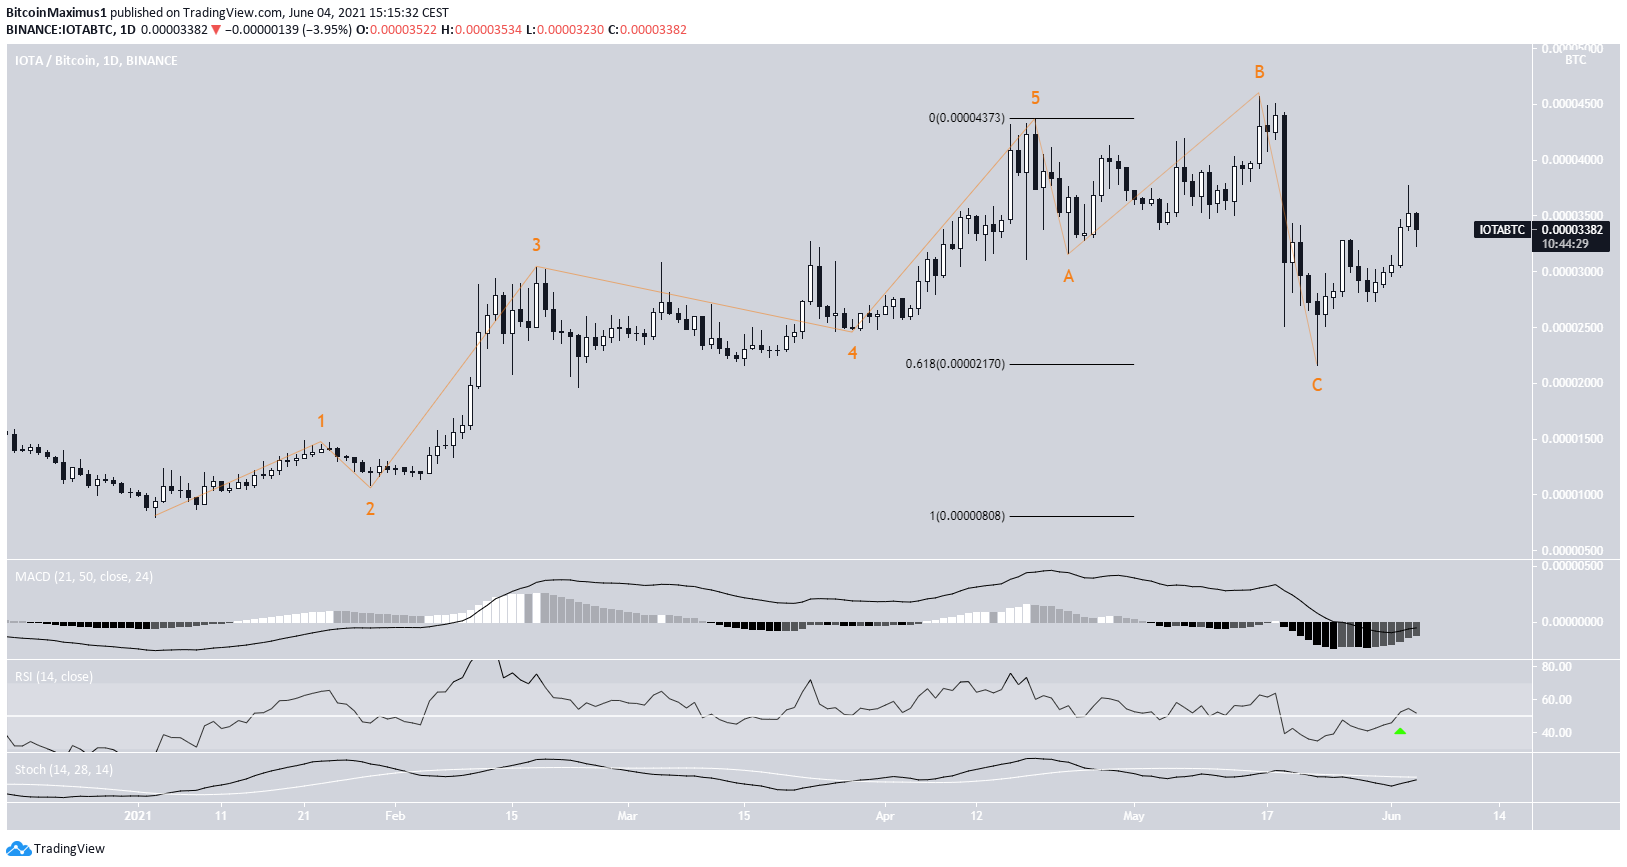
The MIOTA/BTC pair shows similar movement. MIOTA has bounced at the 2,170 satoshi support area, which is the 0.618 Fib retracement support level.
In addition, the entire movement from the January 2021 lows looks like a completed impulse and corrective structure afterwards.
Finally, daily time-frame indicators are more bullish than the USD counterpart, since the RSI has already crossed above 50.

Highlights
- MIOTA has reclaimed the $1.05 support area.
- It is following a descending resistance line.
NEAR
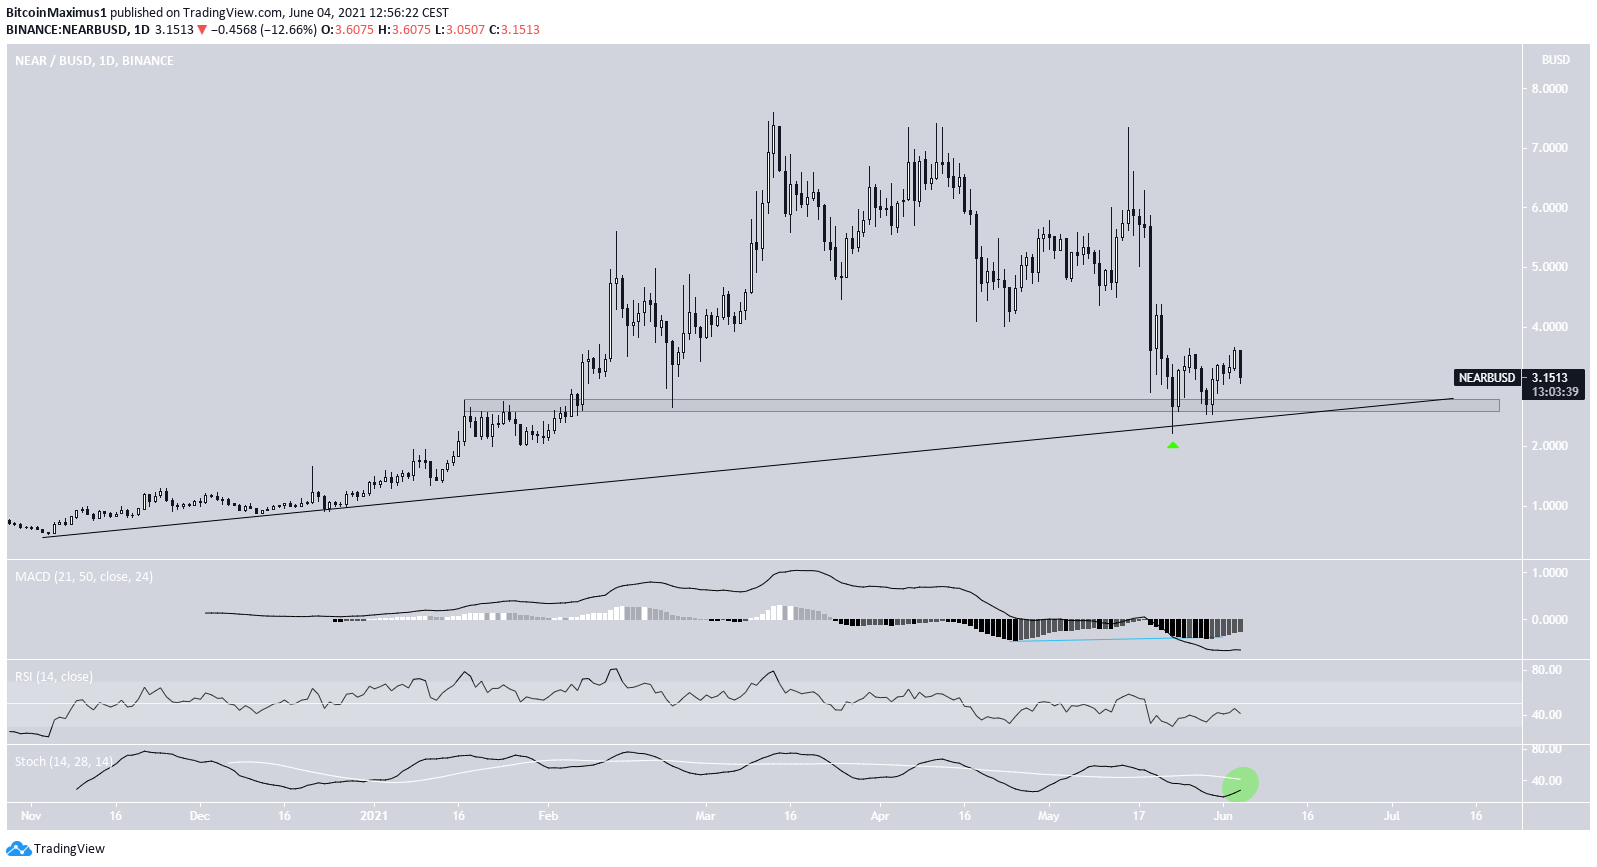
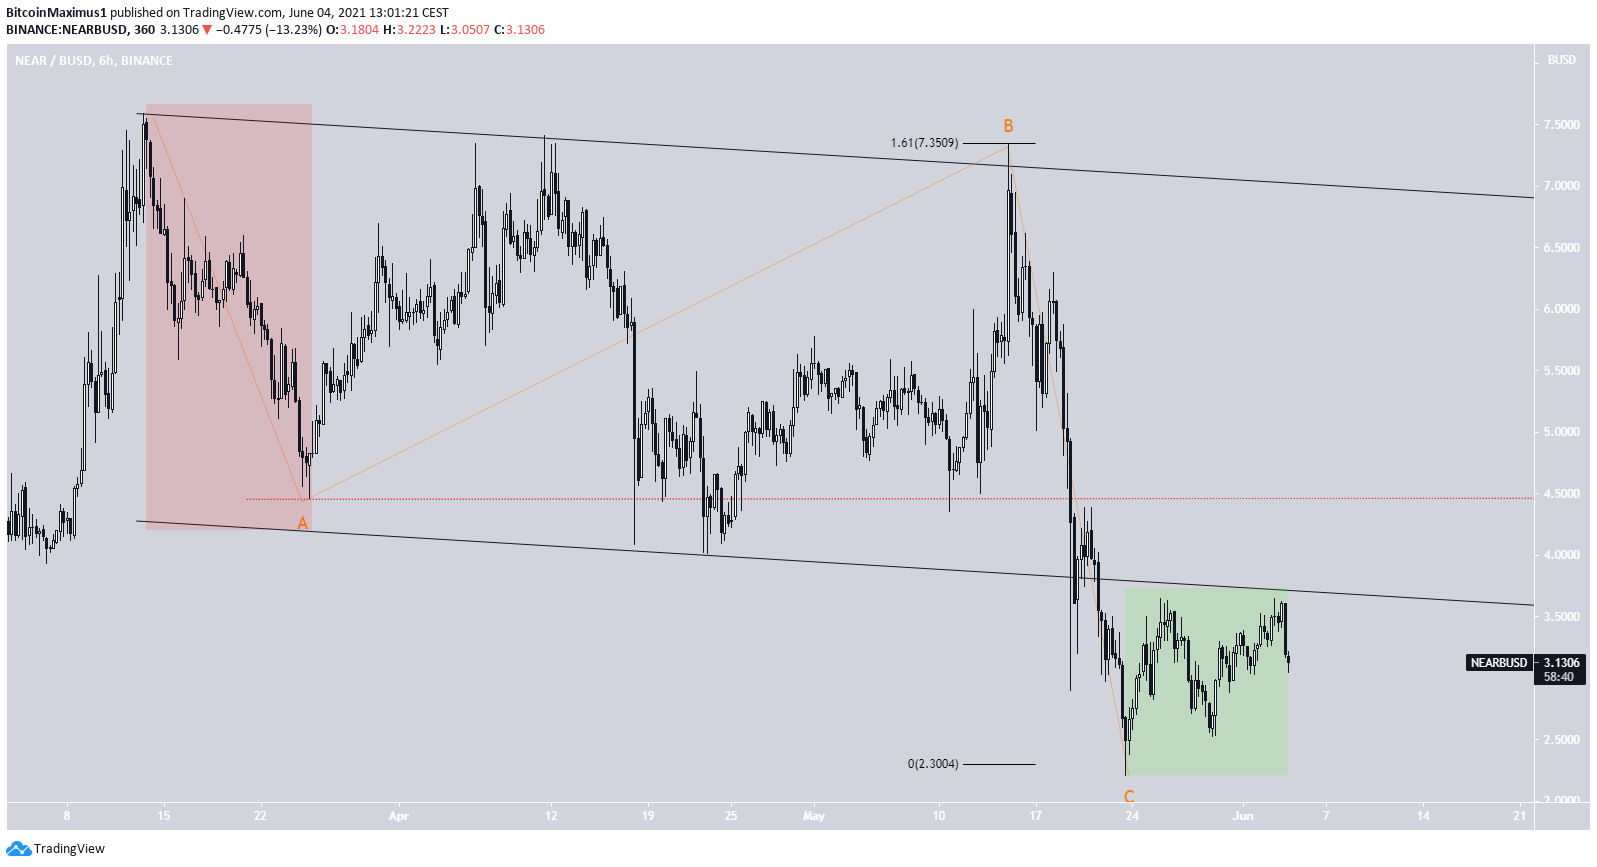
On May 23, NEAR reached a low of $2.21 and bounced (green icon). The low validated a long-term ascending support line, which has been in place since November 2020. Moreover, it also validated the $2.70 horizontal support area.
Technical indicators in the daily time-frame are mixed. There is bullish divergence in the MACD (blue line), but the RSI is below 50.
Whether the Stochastic oscillator makes a bullish cross (green circle) or gets rejected will go a long way in determining the direction of the future trend. Nevertheless, the trend can be considered bullish as long as NEAR is trading above the support line/area.

The wave count provides several more bullish signs. First, the downward movement looks like an A-B-C corrective structure, in which waves A:C had a 1:1.61 ratio, common in such structures.
In addition, the structure of wave A (highlighted in red) looks like a three wave structure instead of a five, indicating that this is not the beginning of a bearish impulse.
Finally, waves A & C were very similar in length of time, further supporting the possibility that this is an A-B-C structure.
However, NEAR has yet to reclaim the channel from which it broke down. Doing so and ideally touching the wave A low of $4.84 (red line) would confirm that this is not the beginning of a bearish impulse.
The move off the lows does not look impulsive (highlighted in green), but the structure is still in its initial phase.
Highlights
- NEAR is following a long-term ascending support line.
- There is horizontal support at $2.75.
COTI
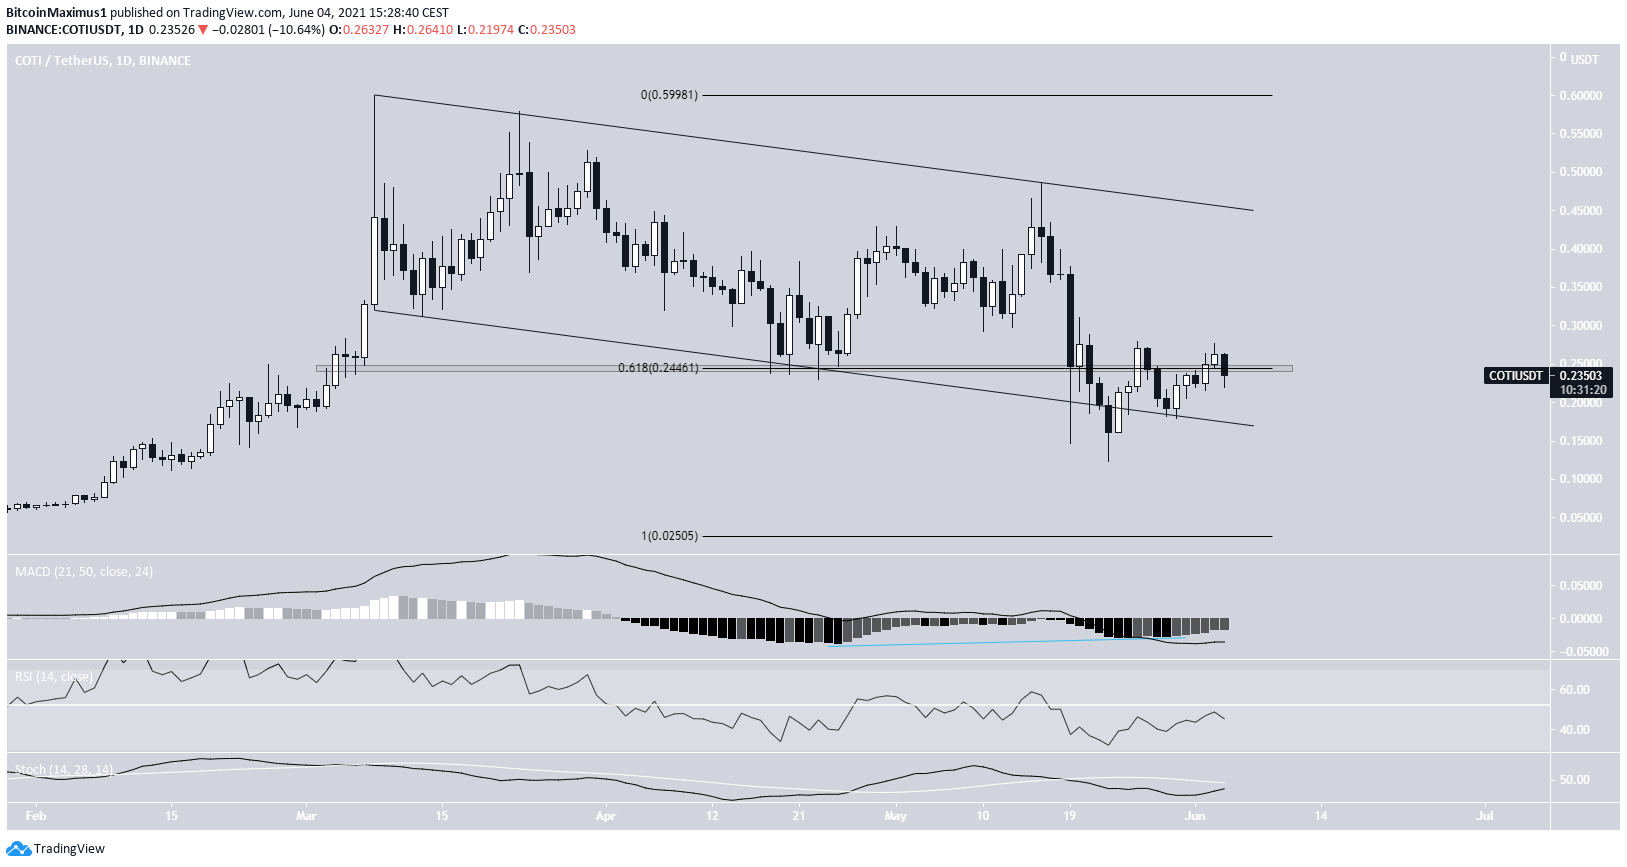
COTI has been decreasing inside a descending parallel channel since March 8.
On May 23, it allegedly broke down from the channel with a low of $0.123. However, it reclaimed the support line the same day and validated it as support afterwards, creating a higher low in the process.
Technical indicators are providing bullish signs. Both the MACD and RSI are moving upwards, the former generating bullish divergence. In addition, the Stochastic oscillator is close to making a bullish cross.
Similarly to IOTA, it is possible that COTI has completed a fourth wave pullback.
However, the token is now facing resistance at $0.245, the 0.618 Fib retracement level. Its reclaim would be a major bullish development, indicating that an upward movement will follow.
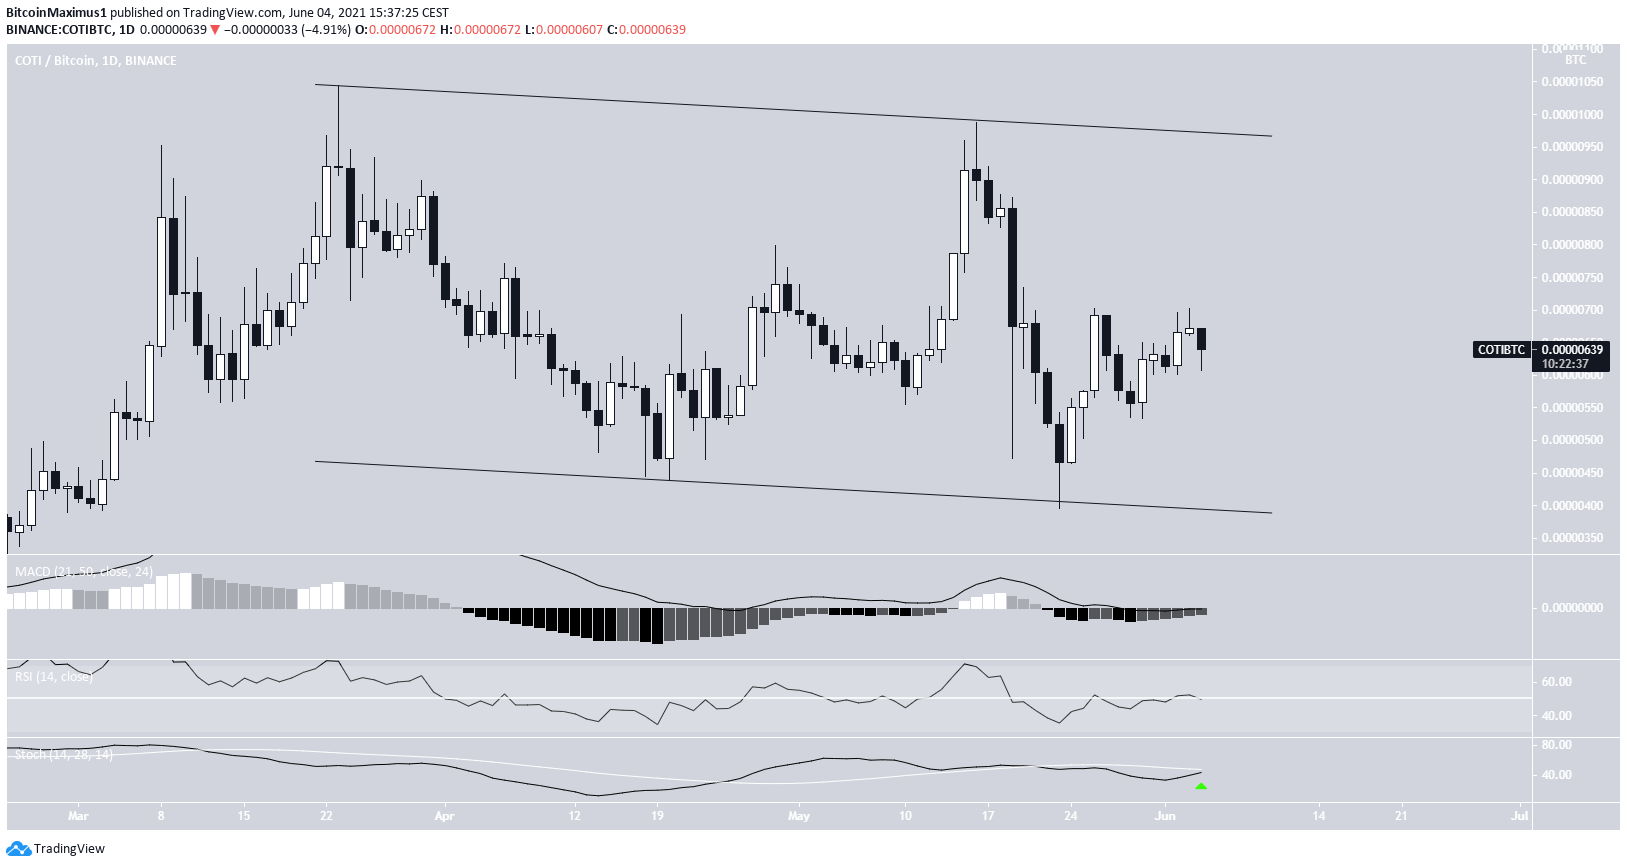
The COTI/BTC pair also shows a descending parallel channel. The token bounced at its support line on May 23 and is now moving upwards.
Technical indicators are more bullish than the USD pair, since the MACD is nearly positive and the Stochastic oscillator has already made a bullish cross (green icon).
Therefore, an upward movement is likely.
Highlights
- COTI is trading inside a descending parallel channel.
- It is facing resistance at $0.245.
For BeInCrypto’s latest bitcoin (BTC) analysis, click here.
Disclaimer
All the information contained on our website is published in good faith and for general information purposes only. Any action the reader takes upon the information found on our website is strictly at their own risk.
This news is republished from another source. You can check the original article here
Be the first to comment