-637336005550289133_Large.jpg)
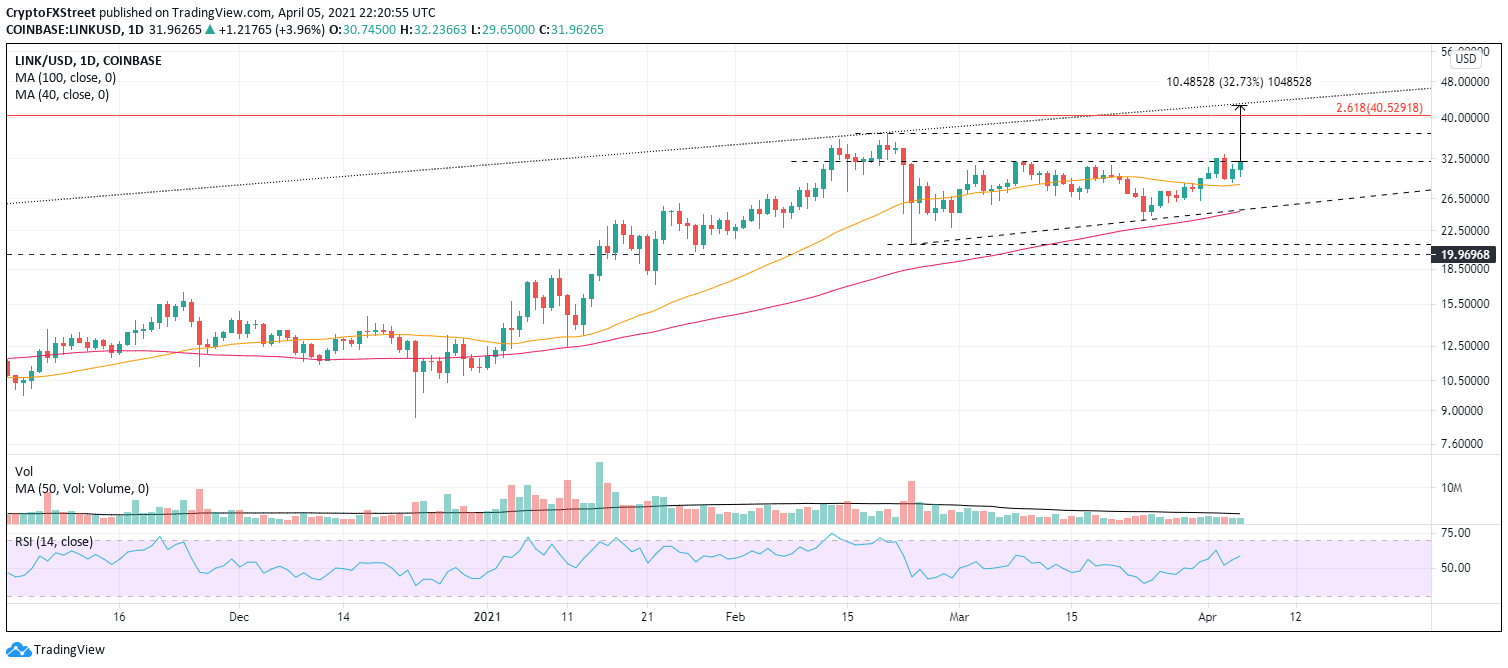
- Chainlink price struggling with short-term resistance at $32.00.
- Whale transaction count registered a spike on April 2.
- Topside trendline comes into play around $42.40.
Chainlink price trended sideways for more than a month and on below-average volume every day, but one. The price action in mid-February, early March, and now point to $32.00 being a psychologically important level. If the level is overcome, the altcoin should rally more than 30% in the coming days.
Chainlink price bottoming out versus Bitcoin
Data from ByBt.com shows that Grayscale bought 115,570 tokens for the Grayscale Trust from March 17 until April 1, which included a large 65,570 purchase last Thursday. Heavy buying like that gets the attention of market participants and may have been behind the 8% on April 2.
Santiment data showed that the number of mid and large holders owning 100-100k LINK tokens notably accumulated during March. Additionally, the so-called whales holding 100,000 to 1,000,000 LINK tokens increased 6% from April 1 – April 3.
LINK whale transaction count chart
The March high was $32.00, and that is the level that LINK has been struggling with over the last few days. A trade above $33.15 will confirm the April 2 breakout and set the stage for a quick advance to the February high at $36.92. The next target is the 2.618 Fibonacci extension of the August 2020-September correction at $40.53.
A 33% gain would accompany a rally to the topside trendline at $42.51, which was resistance at the February high and resulted in a rapid 40% decline. For now, LINK should not be reviewed as a trend trade but a short-term opportunity.

LINK/USD daily chart
The first level of support is at the intersection of the rising trendline and the 50-day simple moving average (SMA) at $24.83, followed by the February 23 low at $21.00. The last gasp support level is the August 2020 high at $20.00.
This news is republished from another source. You can check the original article here

Be the first to comment