
Watch This Episode On YouTube
Listen To This Episode:
In this episode of Bitcoin Magazine’s “Fed Watch” podcast, we invited Dylan LeClair, writer at Bitcoin Magazine, back onto the podcast. LeClair is deep in the weeds of the fundamentals of the bitcoin market. After touching on the price crash of Sept 7, (the day of the podcast recording), our conversation turned to LeClair’s monthly Deep Dive, a large report he writes for Bitcoin Magazine’s exclusive members.
As we made our way through LeClair’s report, we stopped at several of our favorite charts. The first is “supply by liquidity cohort,” seen below. He walked us through the meaning and the takeaways. As you can see on the chart, the vast majority of the bitcoin circulating supply (all bitcoin mined so far) is illiquid, in the sense that it hasn’t moved in a prescribed period of time.
Bitcoin Charts In The Deep Dive
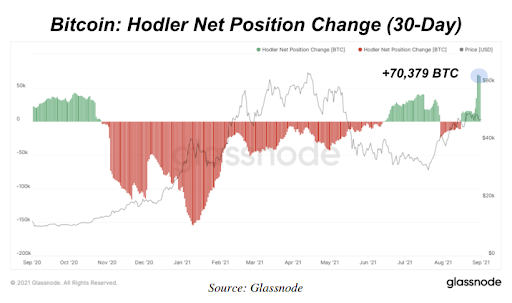
Next, we touched on a chart you may have seen floating around the interwebz, the “HODLer net position change,” measuring the amount of coins that have entered HODLers hands. We discussed several aspects of the below chart, of course, noting the recent increase as well as the net selling which occurred on the way up. This is a lagging indicator, plainly showing that accumulation precedes rallies at which time you get a short squeeze and distribution as price rises.
At this point in our conversation, we also talked about the Grayscale Bitcoin Trust (GBTC) and its possible effect on holding behavior and price. It wasn’t covered in the Deep Dive, but we had a good discussion bringing up several important points. I have written more about the GBTC dynamic here.
The chart we spent possibly the most time on was the hash ribbon chart. It is one of my favorite charts in bitcoin, because it simplifies the entire industry into one chart, with price and hash rate. You can find my version on the “Bitcoin Pulse” published through BitcoinandMarkets.com. Perhaps this indicator is an oversimplification, but the more versed in bitcoin you become, the more detail you can find in this chart.
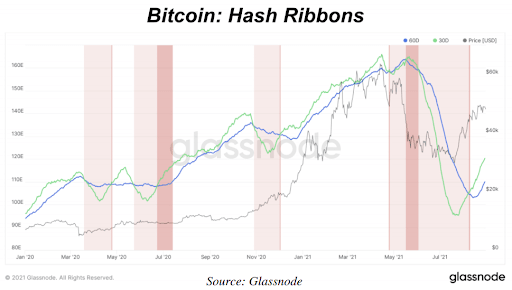
LeClair, Christian Keroles and I went into detail on how unexpected drops in hash rate can signal a crash in prices as it did in March 2020 and again in May 2021. The period around the halving in May 2020 and again in October 2020 to November 2020, with the end of the rainy season in China, were expected.
Macro Charts In Deep Dive
In the August Deep Dive from Bitcoin Magazine, LeClair included a large section on the macro setting, from a U.S. perspective. And this is where we started to disagree slightly. He has charts for Consumer Price Index (CPI), Treasury bond interest rates, government deficit and more. Listeners should know Keroles’ and my views on inflation by now, but LeClair puts together some compelling charts and arguments for why the end of the U.S. dollar system is near.
LeClair also made a fantastic comment when covering his section on the Triffin dilemma. Paraphrasing, he said, “Robert Triffin’s proposed solution to the dilemma back in the 1960s was to adopt a Keynesian Bancor as international reserve currency. Today, we have bitcoin, which can fit that role.”
It is interesting that bitcoin is a perfect combination of a gold standard and a Bancor-like currency.
We can’t cover everything from the podcast here, you really must go and listen and watch on YouTube. We will be trying to get LeClair back on the show on a regular basis to discuss his deep knowledge of the bitcoin industry.
This news is republished from another source. You can check the original article here
Be the first to comment