The crypto-currency market is mostly trading sideways and looks to be corrective within a downtrend.
Of course, there are some shitcoins with bigger rallies, but once the major crypto-currencies complete their intraday upward corrections, this is when most of these coins could hit the wall and turn lower.
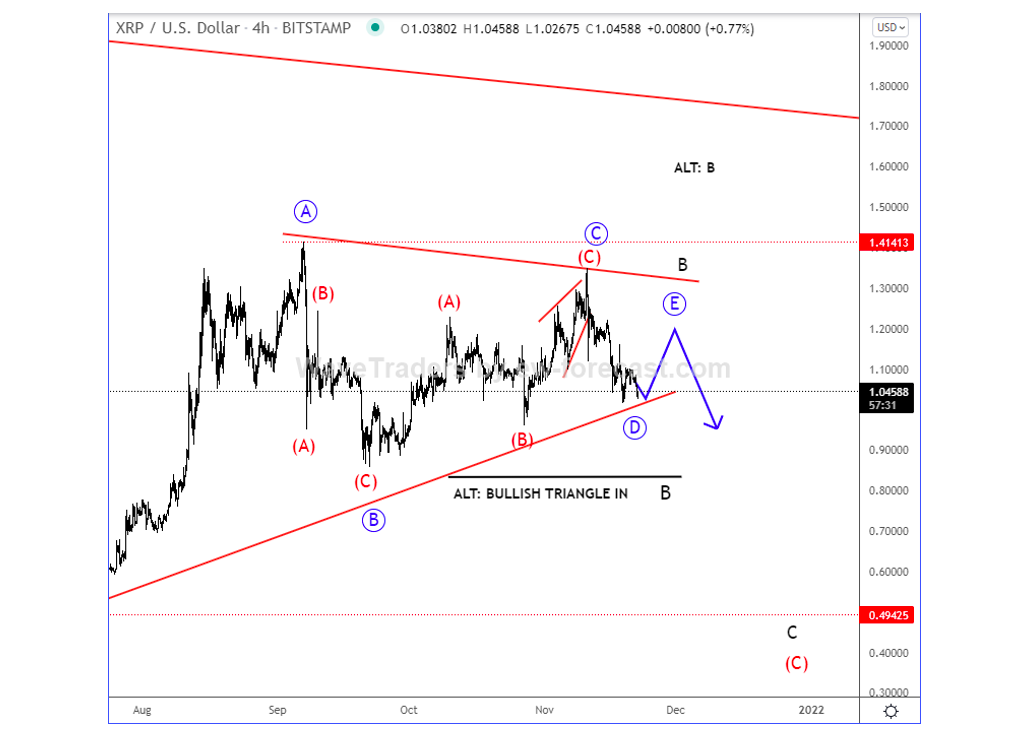
Ripple (XRPUSD) is coming nicely lower as expected, but the wave structure is still mostly sideways, so considering that triangle pattern in wave B, a new intraday recovery for subwave E may not be far away. Keep in mind, though, that bears may now easily take the lead. There are still many other options, maybe even a bullish triangle pattern in case if XRP jumps by itself, so previous highs can be potentially still retested before real bears show up.
Ripple 4-hour Elliott Wave Analysis
Bitcoin Cash after reaching lower triangle line for wave D, can be now making the final wave E of a bigger bearish triangle pattern in wave (B), which means that a sell-off for wave (C) may not be far away. So, in case if BCH breaks back below 530 bearish confirmation level, then we can start tracking wave (C).
Bitcoin Cash 4-hour Elliott Wave Analysis

Twitter: @GregaHorvatFX
The author may have a position in the mentioned securities at the time of publication. Any opinions expressed herein are solely those of the author, and do not in any way represent the views or opinions of any other person or entity.
This news is republished from another source. You can check the original article here

Be the first to comment