

- Bitcoin price has witnessed the largest inflow and outflow of tokens to and from exchanges this year.
- Ethereum price shows the largest influx of transfers to exchanges since inception.
- XRP price may head south once more based on weakening signals.
The cryptocurrency market displays mixed signals but hints that the bearish trend is not over yet. Adopting a get-in-get-out mentality may be the more favorable approach for investors looking to expose themselves to the market.
Bitcoin price should get volatile
Bitcoin price is currently trading at $20,220. Despite the optimistic signals, BTC failed after presenting eye-candy-like behavior. On-chain analysis suggests volatility is imminent. Thus, staying in sync with the market makers’ true intentions for BTC will be difficult.
Santiment’s Exchange indicators show the largest inflow and outflow of tokens to and from exchanges. On September 14, 284,000 Bitcoin came into the market amidst the decline from $20,200. On the same day, 291,000 went out of the market. This could indicate whales are in the market, pushing the price lower.
Still, based on historical data, influxes of exchange movement usually lead to extremely volatile crypto environments. In the previous year, one more correction to the downside occurred after the indicator spike, followed by a massive bull run.
In summary, Bitcoin price may be near the bottom, but traders should expect challenging days to come if they want to stay in sync with the correct trend to define the rest of the year.
Santiment’s Exchange Inflow & Outflow Indicators
In the following video, our analysts deep dive into the price action of Bitcoin, analyzing key levels of interest in the market. -FXStreet Team
Ethereum price is fighting an uphill battle
Ethereum price currently auctions at $1,374 as the bulls attempt to reclaim the $1,400 terrain. The decentralized smart contract token successfully breached the 7-day exponential and 21-day simple moving averages. There is also an uptick in volume that accompanies the bullish price action. Still, like BTC, the Ethereum price movements may be more of a short-term play than the start of a new bull run.
According To Glassnode’s Exchange Deposits indicator, Ethereum witnessed the largest influx of deposits onto exchanges since its inception. In July, when the ETH price auctioned for $1,435, over 633,000 transfers of Ethereum to all exchanges were made. Based on historical evidence, large deposits usually result in significant sell-offs. Unlike Bitcoin, the withdrawals have been nowhere near the 633,000 transactions suggesting investors are still interested in selling the decentralized smart contract token for short-term gains.
Combining these factors, Ethereum price may be fighting a steeper uphill battle than meets the eye. Caution should be exercised in the coming days as a breach of the summertime lows at $880 remains an outstanding possibility.
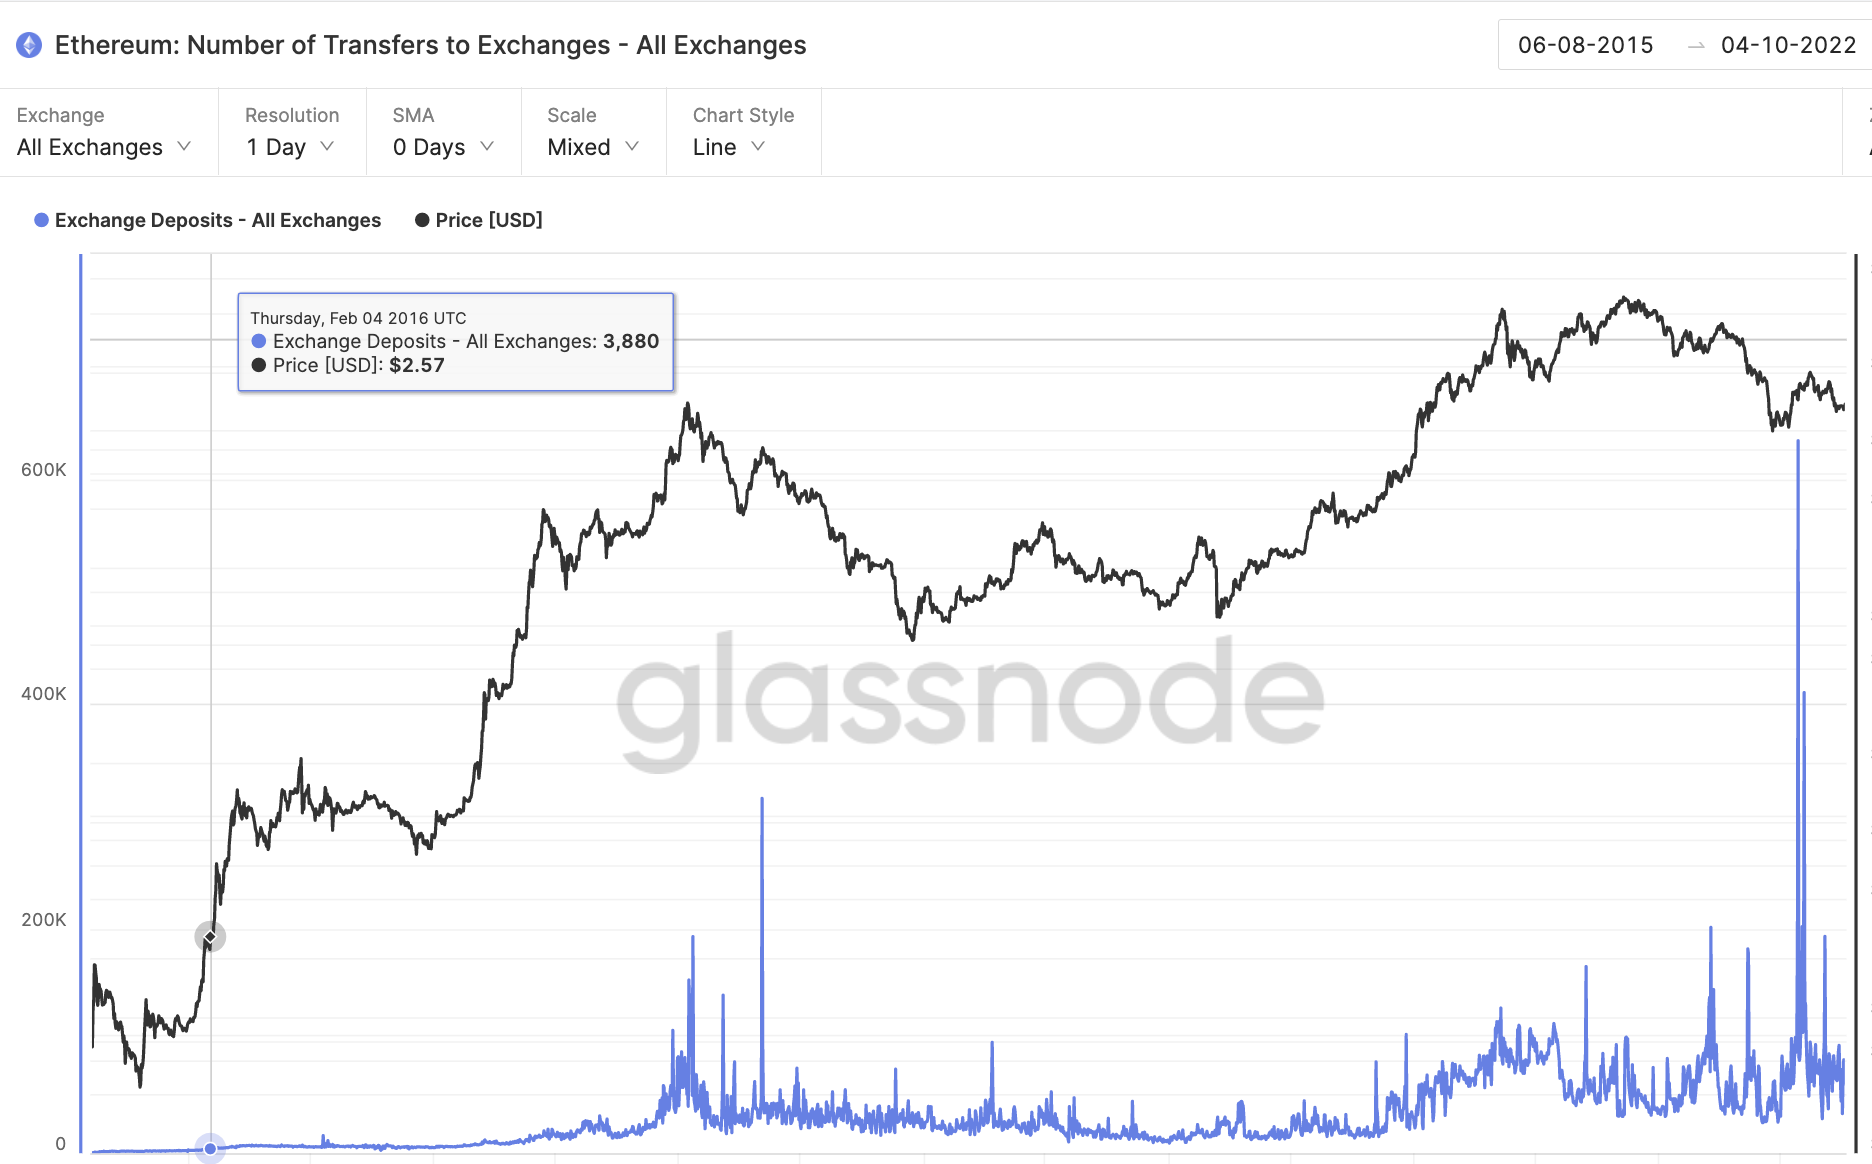
Glassnode’s Number of Transfers to Exchanges
In the following video, our analysts deep dive into the price action of Ethereum, analyzing key levels of interest in the market. -FXStreet Team
XRP price setting up for a pullback
Ripples’ XRP price may have stalled once too many as the digital remittance toke failed to hold grounds above the $0.50 level. During the last two attempts to hurdle the psychological barrier, a declining volume pattern is shown compared to the previous bull run that brought XRP into the current range. This is a subtle cue that the uptrend is weakening.
XRP price currency auctions at $0.49. Strong bearish candles have entered the market and even wiped out the strongest candle in the rally near $0.47 on October 5. This key signal confounds the idea that the uptrend is losing steam. If market conditions persist, a breach into the 8-day exponential moving average at $0.47 stands a fair chance of occurring. If the $0.47 level does not hold, a fall into $0.40 will be imminent.
Invalidation of the bearish thesis is a break above the initial swing high at $0.51. A breach of this level would open the possibility of an additional 10% rally toward $0.55.
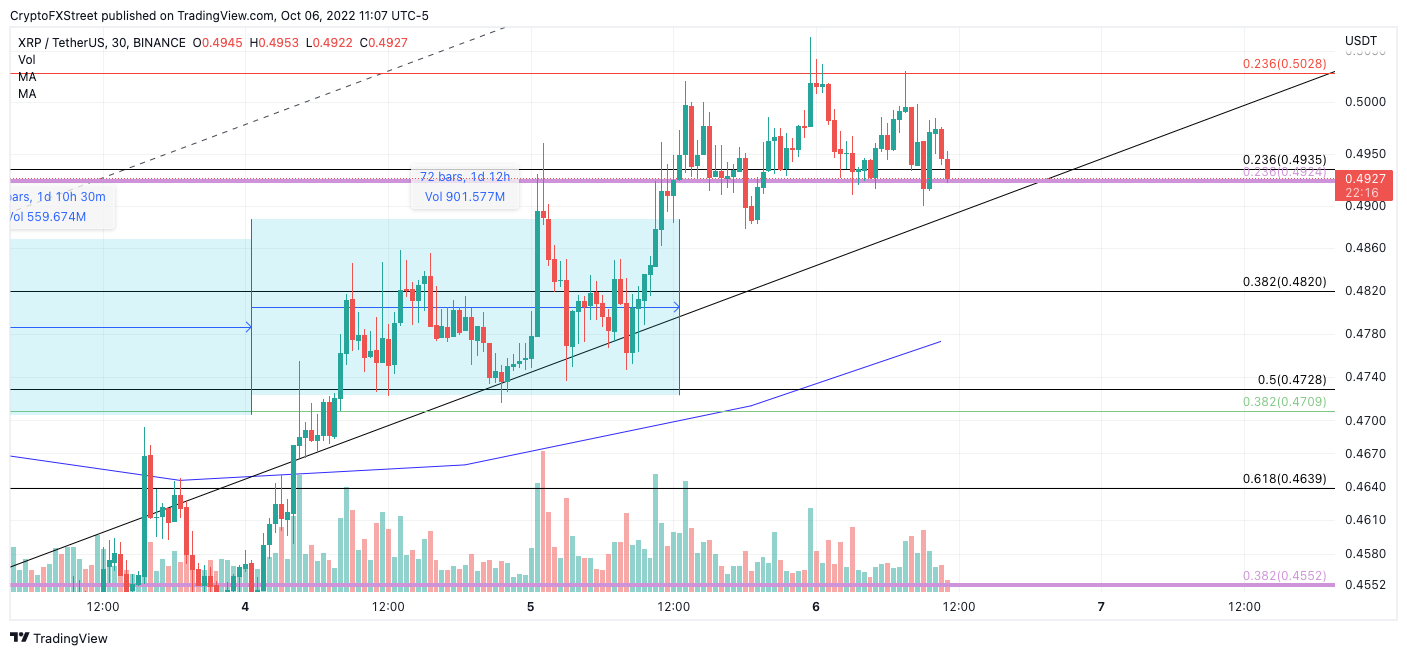
XRP/USDT 30 Min achart
In the following video, our analysts deep dive into the price action of Ripple, analyzing key levels of interest in the market. -FXStreet Team
This news is republished from another source. You can check the original article here
Be the first to comment