Bitcoin Analysis
Bitcoin’s price once again climbed above the $20k level on Tuesday before the macro impact of markets outside of crypto dragged the asset back below $20k and then $19k before eventually returning back above the $19k level to close Tuesday’s trading session. When the day’s candle had concluded, BTC’s price was -$132.9.
The BTC/USD 1HR chart below charted by Luckyjimbob111 is where we’ll begin today’s price analyses. BTC’s price is trading between the 0.786 fibonacci level [$18,936.8] and 0.618 [$19,245.99], at the time of writing.
It’s imperative for bullish traders to again regain $19,891 [BTC’s 2017 all-time high] to feel confident in the short-term about BTC’s price.
Bullish BTC market participants have targets to get back to that level of 0.618, 0.5 [$19463.17], 0.382 [$19,680.34], and lastly 0.236 [$19,949.04] to eclipse it. The last target to reclaim the latest high from early on in Tuesday’s daily candle is 0 [$20,383.39].
Bearish traders that believe further downside is inevitable with the macro climate outside of crypto still struggling are targeting 0.786, 0.887 [$18,750.91], and 1 [$18,542.94].
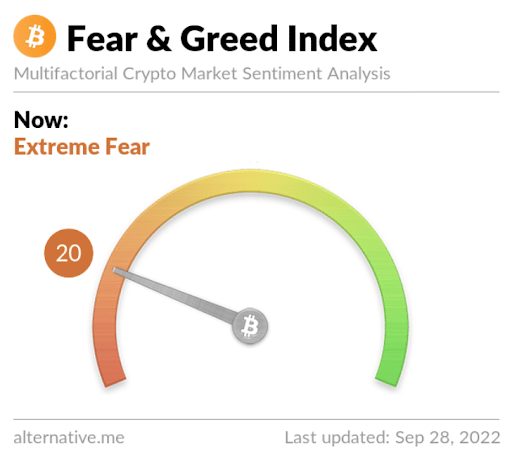
The Fear and Greed Index is 20 Extreme Fear and is even to Tuesday’s reading.

Bitcoin’s Moving Averages: 5-Day [$19,254.56], 20-Day [$19,799.75], 50-Day [$21,525.73], 100-Day [$23,239.85], 200-Day [$32,403.7], Year to Date [$31,721.66].
BTC’s 24 hour price range is $18,838-$20,385 and its 7 day price range is $18,424.7-$20,385. Bitcoin’s 52 week price range is $17,611-$69,044.
The price of Bitcoin on this date last year was $41,064.
The average price of BTC for the last 30 days is $19,854 and its -5.7% over the same period.
Bitcoin’s price [-0.69%] closed its daily candle worth $19,069 on Tuesday and it’s finished in red figures for four of the last five days.
Ethereum Analysis
Ether’s price also reversed course after a strong outing to begin Tuesday and when traders concluded Tuesday’s trading session, Ether was -$8.84.
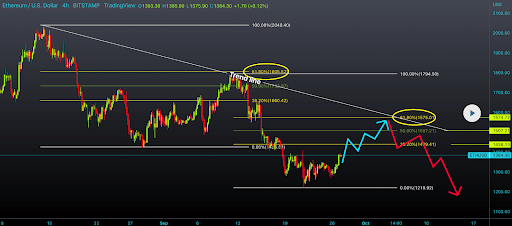
The ETH/USD 4HR chart by Alex_master_forex is the second chart we’re analyzing for this Wednesday. ETH’s price is trading between the 0.00% fib level [$1,219.92] and 38.20% [$1,439.41], at the time of writing.
Bullish Ether market participants are seeking to again reclaim the $1,400 level [ETH’s 2017 ATH] before regaining the 38.20% fib level. The next targets overhead for Ether bulls are 50.00% [$1,507.21] and 61.80% [$1,575.01].
Bearish Ether traders are conversely looking to test the recent low at the 0.00% fib level and crack $1,219.92 to reach a new low for September.

Ether’s Moving Averages: 5-Day [$1,329.35], 20-Day [$1,506.80], 50-Day [$1,612.19], 100-Day [$1,560.41], 200-Day [$2,293.95], Year to Date [$2,226.97].
ETH’s 24 hour price range is $1,303.75-$1,400 and its 7 day price range is $1,238.84-$1,400. Ether’s 52 week price range is $883.62-$4,878.
The price of ETH on this date in 2021 was $2,807.67.
The average price of ETH for the last 30 days is $1,501.92 and its -11.92% over the same time frame.
Ether’s price [-0.66%] closed its daily candle on Tuesday worth $1,328.17 and it’s finished in red figures for three of the last four days.
Chainlink Analysis
Chainlink’s price was the one outlier for today’s price analyses and when traders settled-up on Tuesday, LINK’s price was back above the $8 level for the first time since September 17th and +$0.11.
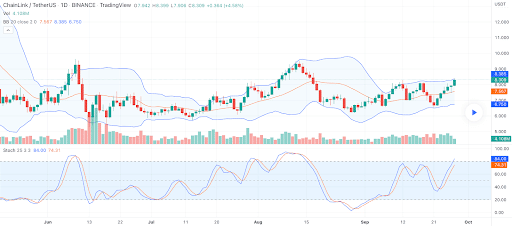
The LINK/USDT 1D chart below from Bitcoin_Analyzer shows Chainlink’s price arguably bear-flagging but bulls are in the process of attempting to negate this pattern.
Bullish Chainlink traders have put in six straight green candles on the daily time frame with the much anticipated SmartCon 2022 event taking place today and tomorrow in New York City.

Chainlink’s Moving Averages: 5-Day [$7.42], 20-Day [$7.25], 50-Day [$7.43], 100-Day [$7.16], 200-Day [$11.86], Year to Date [$11.48].
Chainklink’s 24 hour price range is $7.65-$8.4 and its 7 day price range is $6.63-$8.4. LINK’s 52 week price range is $5.32-$38.17.
Chainlink’s price on this date last year was $22.12.
The average price of LINK over the last 30 days is $7.27 and its +23.99% over the same duration.
Chainlink’s price [+1.38%] closed its daily session on Tuesday worth $8.06.
This news is republished from another source. You can check the original article here

Be the first to comment