

- Bitcoin price extended its upswing to $55,800 after an 18% ascent.
- Ethereum price showed no reaction as it stayed below the $3,619 resistance barrier.
- Ripple price remained relatively lull as it tested the $1.05 support level.
Bitcoin price showed a massive uptick in buying pressure, which could be driven by the expected launch of BTC Futures ETF in October. While investors put their capital into BTC, altcoins continue to show no strength.
Bitcoin price at crucial level
Bitcoin price is currently hovering around $55,000, just above the 70.5% Fibonacci retracement level at $54,182 or inside the high probability reversal zone. Moreover, the Momentum Reversal Indicator (MRI) has flashed a preemptive sell signal in the form of a yellow down arrow on the daily chart. This formation suggests that another green daily candlestick will create a red ‘one’ sell signal that forecasts a one-to-four candlestick correction.
Therefore, investors need to be aware of a correction that follows after a sudden uptick. The support level at $51,096, coinciding with the 62% Fibonacci retracement level, or the supply zone ranging from $48,834 to $47,316 are the areas where buyers will accumulate more BTC.
BTC/USD 1-day chart
On the other hand, if Bitcoin price continues to head lower, breaching the 50% Fibonacci retracement level at $46,738, it will invalidate the bullish thesis. In such a case, BTC could retest the $45,000 support floor.
Ethereum price lacks strength
Ethereum price showed a strong surge after a breakout from the parallel channel’s upper trend line on October 1. This rally tested the $3,398 resistance level and flipped it into a support foothold. However, since this point, ETH has lost strength while hovering below the next barrier at $3,619. If the big crypto retraces, Ethereum price will likely follow suit and retest $3,398. In a dire scenario, the smart contract token might revisit the $3,202 demand barrier.
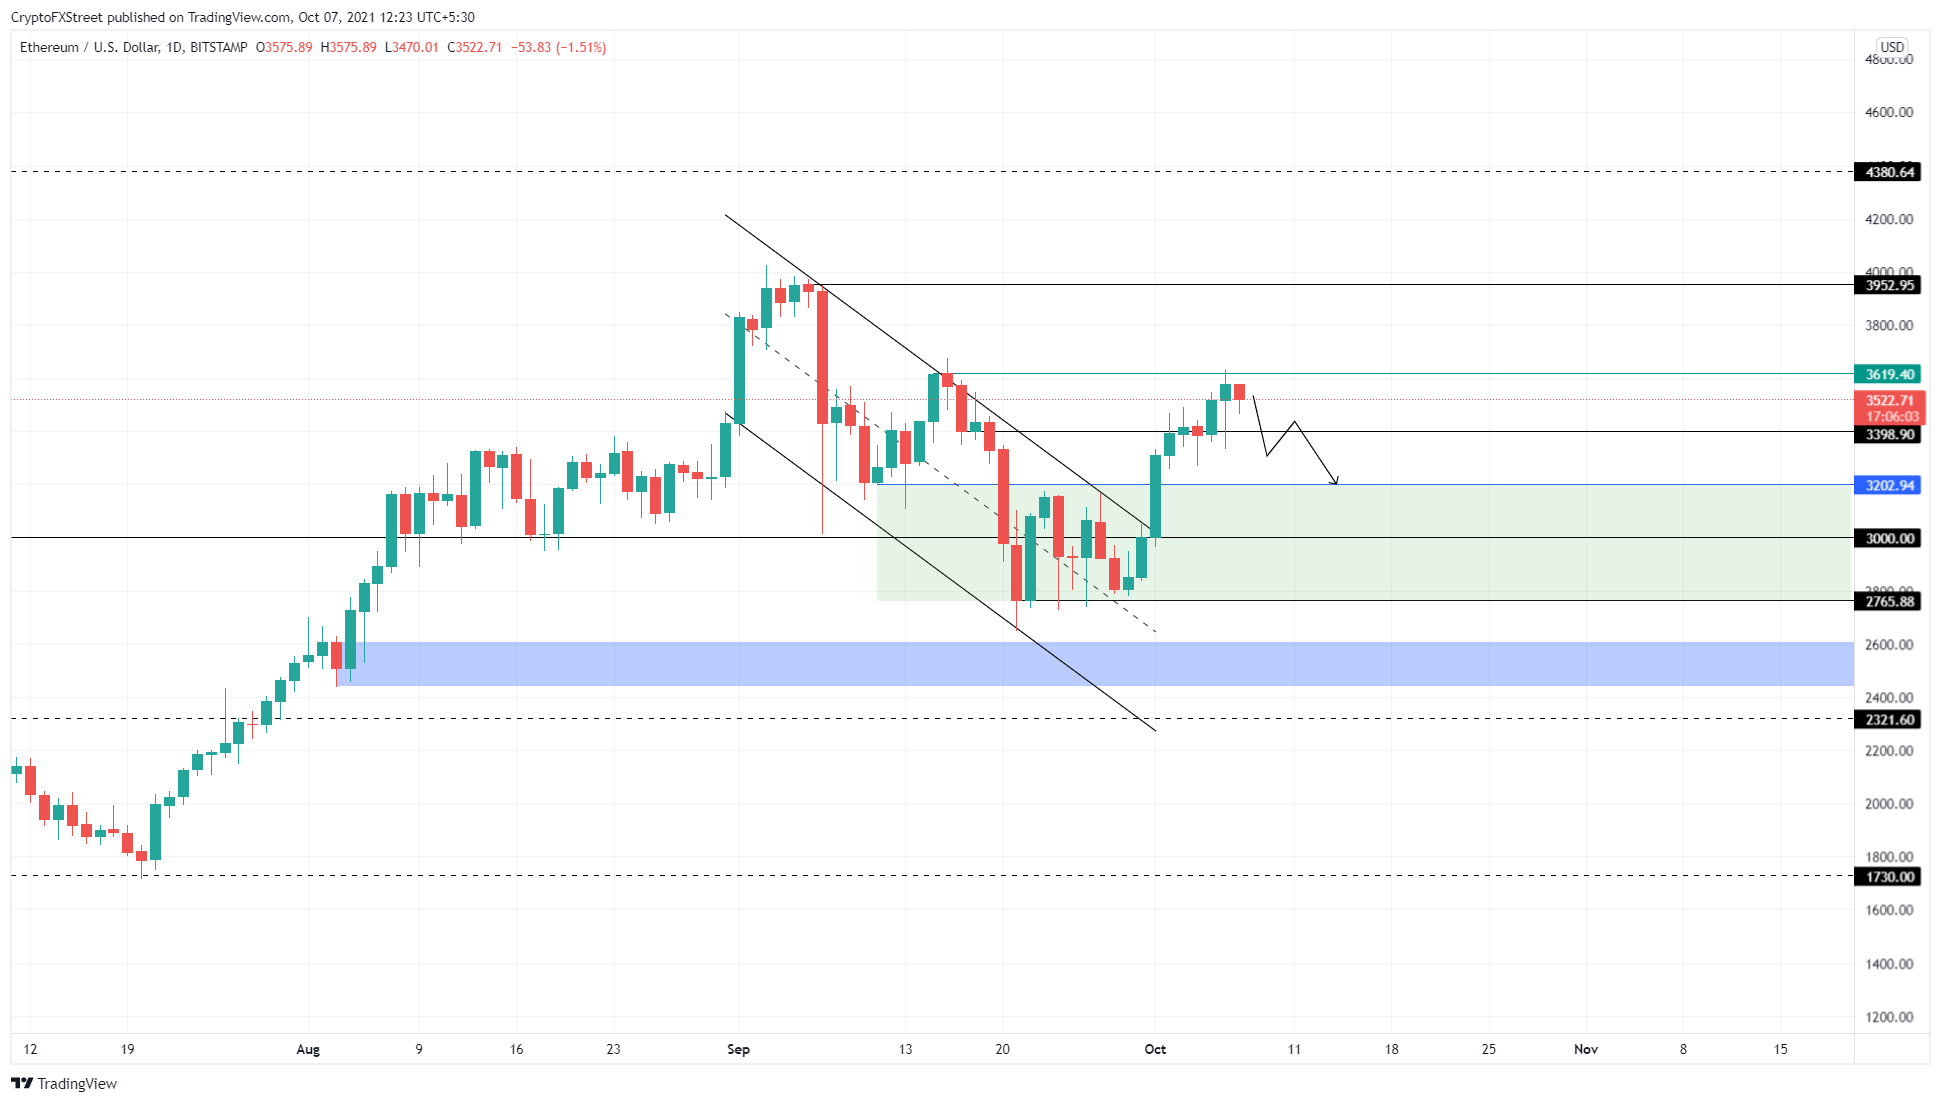
ETH/USD 1-day chart
While things are looking tough for Ethereum price, a decisive close above $3,619 will flip a major hurdle into a platform, invalidating the bearish thesis. This move will allow ETH to be propelled to $3,952 or the $4,000 psychological level.
Ripple price is all out of volatility
Ripple price rallied 17% since October 1, which is relatively less than its peers like Bitcoin, Ethereum and so on. Regardless, XRP price managed to slice through a critical resistance barrier at $1.05 and is currently hovering above it.
While the bellwether cryptocurrency contemplates a retracement, investors can expect the remittance token to do the same. In which case, the $1.05 support floor will be breached, knocking Ripple down to $1 or $0.95.
Depending on the selling pressure and the buyers’ ability to make a comeback, this downswing can stop at the $0.95 barrier or head even further to revisit $0.87. This move would constitute a 20% descent for Ripple price.
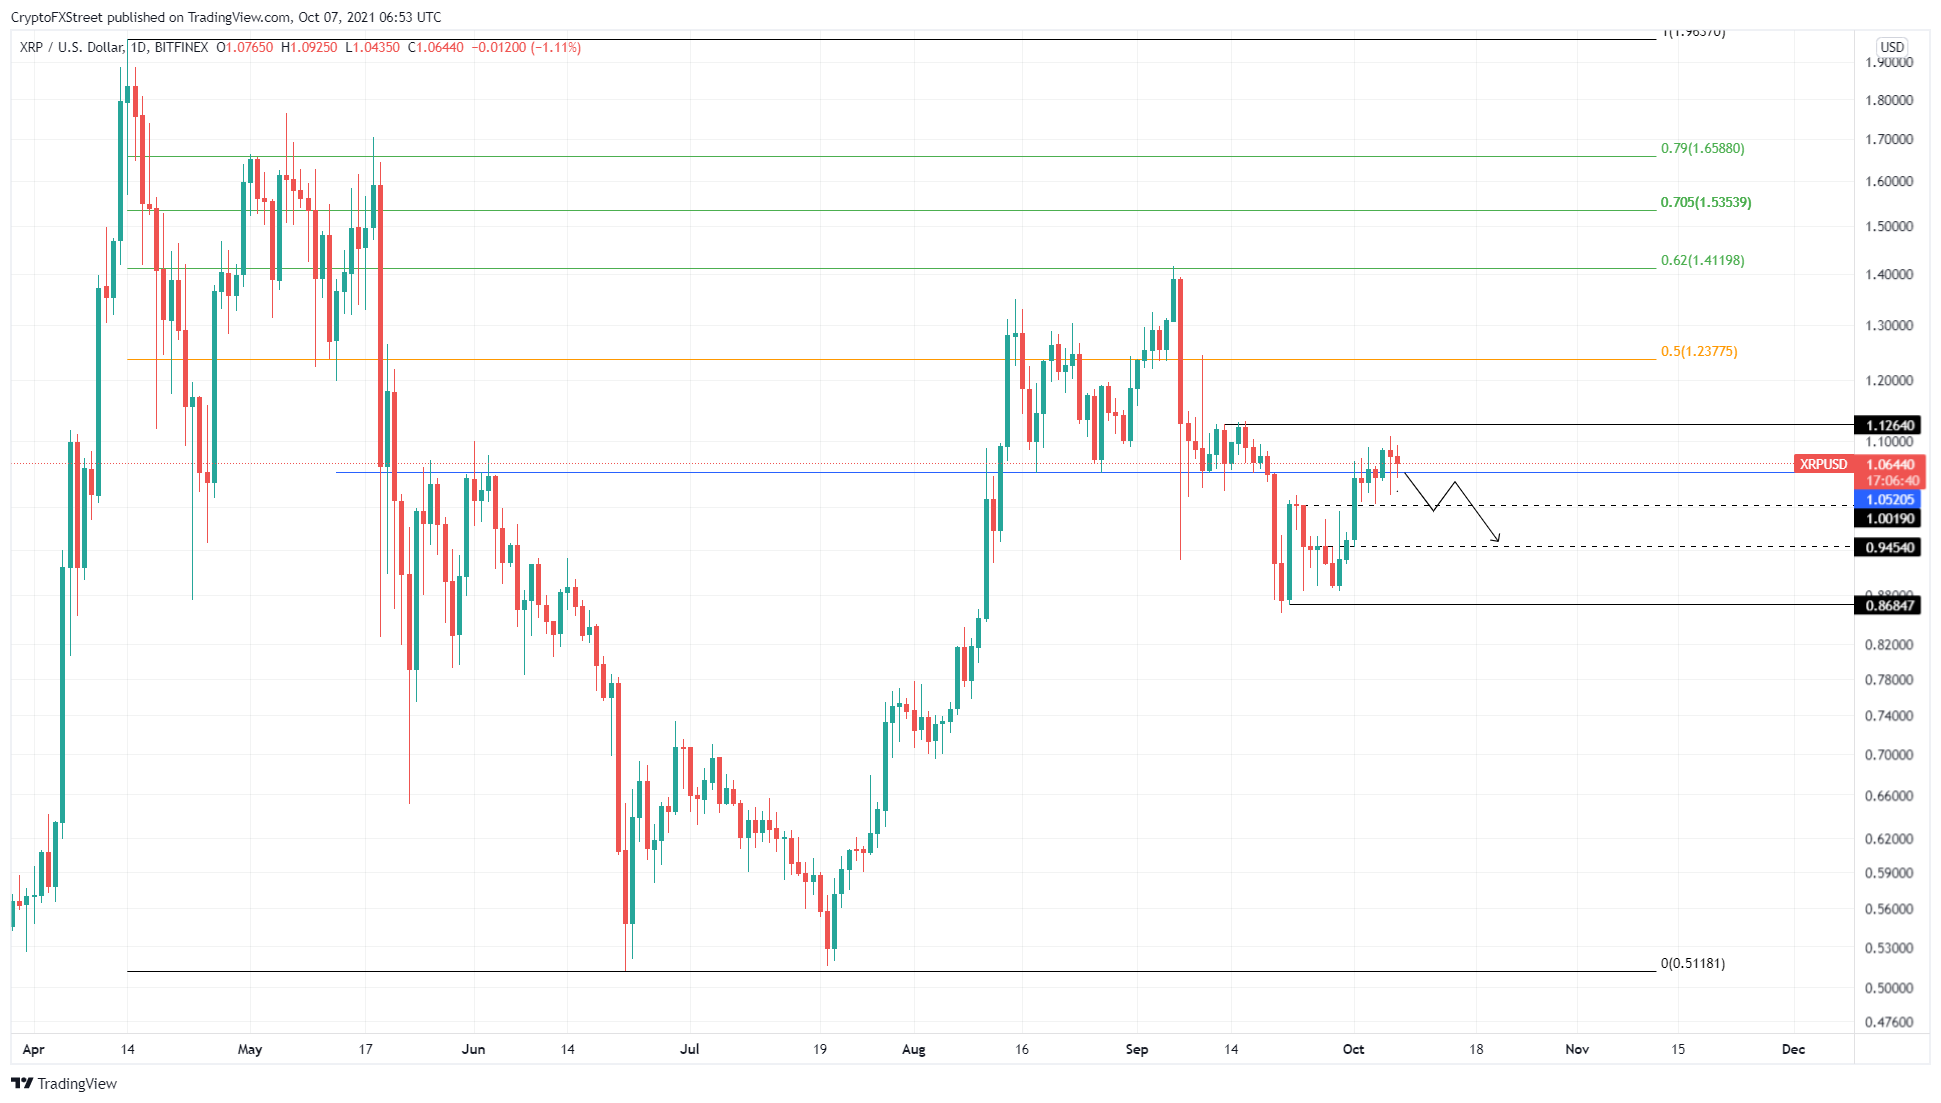
XRP/USD 1-day chart
The short-term bearish outlook is made on the assumption that Bitcoin price corrects. However, if BTC continues to rally, investors can expect XRP price to follow suit. In this situation, a decisive close above $1.12 will invalidate the bearish thesis. Moreover, it will signal that the buyers are not done yet. In this scenario, Ripple bulls might even kick-start a 37% uptrend to $1.54.
This news is republished from another source. You can check the original article here
Be the first to comment