

Ethereum (CRYPTO: ETH) began to decline rapidly at 1:30 p.m. EST on Friday after PBS news reporter Nick Schifrin said on Twitter that, according to six U.S. and western officials, Russia will begin to invade Ukraine next week, beginning with two days of aerial bombings and electronic warfare.
At that same time, the SPDR Gold Trust (NYSE: GLD) began to shoot up, rising over 1% higher within about 20 minutes. This indicates gold is currently considered the better safe haven asset over cryptocurrencies.
The crypto sector has been rebounding since Jan. 24 but Friday’s decline caused Ethereum to drop out of a rising channel, which indicates the short bull cycle could be over.
The Gold Trust has also been trading higher recently, but on Friday its rise accelerated on higher-than-average volume, which indicates a high level of interest in the ETF.
See Also: Bitcoin, Ethereum, Dogecoin Slump After Inflation Report —What If Feds Decide To No Longer Hodl Their Stash?
The Ethereum Chart: Ethereum had been trading in a rising channel since reversing course, creating a series of higher highs and higher lows as it worked its way north in an uptrend.
- The most recent lower high is at $2,672.84, and if Ethereum drops below the level, it will negate the uptrend and throw the crypto into a possible downtrend.
- Ethereum’s afternoon decline came on higher-than-average volume on lower timeframes, which indicates the bears are in control.
- The move lower caused Ethereum to lose support at the eight-day exponential moving average (EMA). Bulls will want to see the crypto hold above the 21-day EMA or the eight-day EMA will cross below it, which would be bearish.
- On Feb. 6, Ethereum broke up through a descending trendline that had been holding it down since the crypto reached a high near $4,800 on Dec. 1. The crypto may find support at the trendline if it continues to fall to the area.
- Ethereum has resistance above at $3,057.82 and $3,240.01 and support below at $2,890 and $2,609.02.
Want direct analysis? Find me in the BZ Pro lounge! Click here for a free trial.
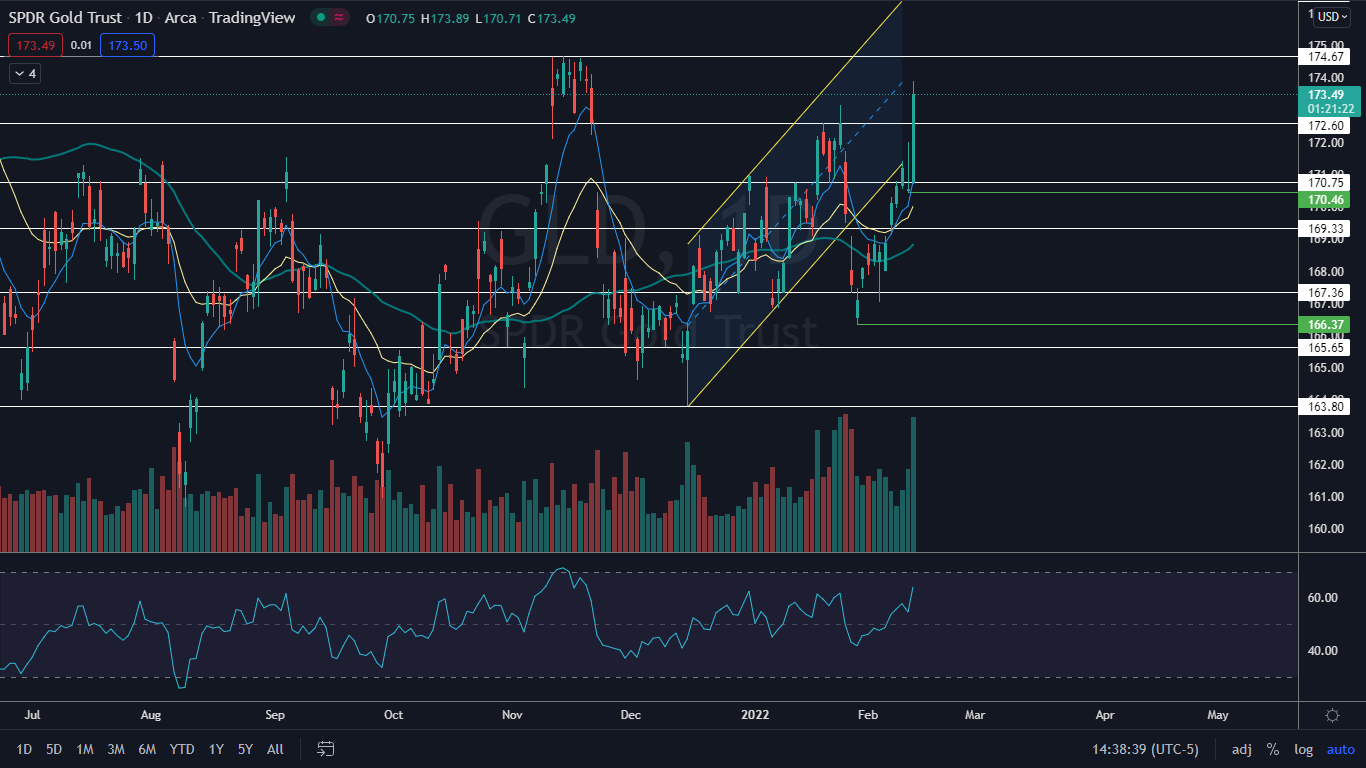
The Gold Trust Chart: GLD reversed course into an uptrend on Jan. 28 and has since made a series of consecutive higher highs and higher lows, with the most recent higher low printed on Thursday at $170.46 and the most recent higher high created on Friday.
- Eventually GLD will need to pull back to print another higher low above Thursday’s low-of-day, which could provide bullish traders not already in a position a solid entry level, with a stop placed at that low.
- The pullback may come on Monday or Tuesday if GLD continues to run higher because its relative strength index will become extended. On Friday, the RSI oscillator was measuring in at about 64%, which is nearing overbought territory.
- GLD has resistance above at $174.67 and $176.63 and support below at $172.60 and $170.75.
This news is republished from another source. You can check the original article here
Be the first to comment