

Ethereum, TRON, and Iota have outperformed most other major cryptocurrencies by the 30-day Sharpe ratio, a measure developed by Nobel laureate William F. Sharpe to evaluate the return of an investment relative to its risk. Meanwhile, Bitcoin’s performance was dismal.
Within the last 30 days, the market has experienced a robust recovery after bottoming out in December. One indicator, the Sharpe ratio, calculates the performance of an investment adjusted for the risk-free interest rate per unit of volatility.
To calculate the Sharpe ratio, first, the risk-free rate is typically determined using U.S. Treasury Bills as a zero-risk benchmark. Then, over a given period of time, the rate of return of an investment is calculated. The risk-free rate is subtracted from the rate of return of the investment to produce the amount of excess return. Finally, the excess return is divided by the standard deviation (volatility) to produce the Sharpe ratio.
(Average Cryptocurrency Return – Risk-Free Rate) / Cryptocurrency Standard Deviation
The greater the returns over the risk-free return, the higher the Sharpe ratio. More consistent returns over time also produce a higher Sharpe ratio. Meanwhile, a negative ratio indicates that the return on investment was lower than the risk-free interest rate in a given period.
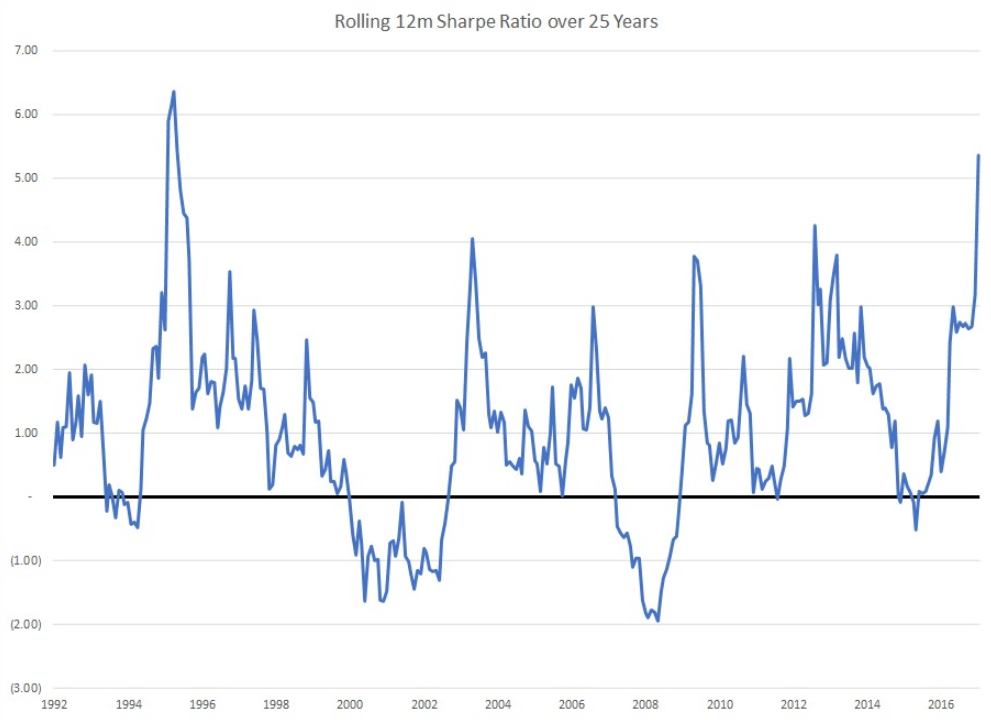
For comparison, U.S. Treasury Bills have a Sharpe ratio of zero. The S&P 500, an index of stocks from the largest 500 U.S. companies, had a rolling 12-month Sharpe ratio of approximately 1.0 over the last 25 years.
Understandably, cryptocurrency has a very low—and sometimes even negative—Sharpe ratio because of its extreme volatility. The chart below shows the lifetime volatility of bitcoin’s daily rate of return relative to the S&P 500:
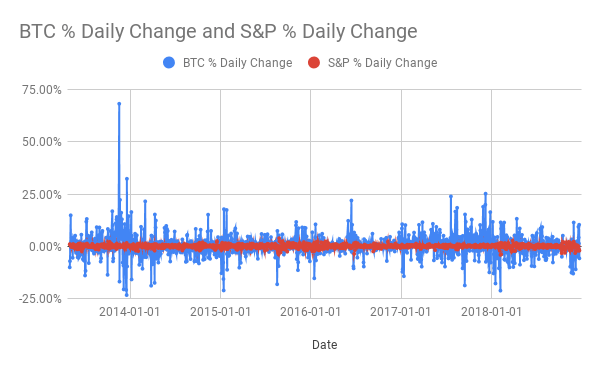
The chart emphasizes the extreme levels of volatility experienced by bitcoin, even when compared to a moderately volatile index, such as the S&P 500.
On Jan. 4th, LongHash calculated the 30-day Sharpe ratio for various cryptocurrencies:
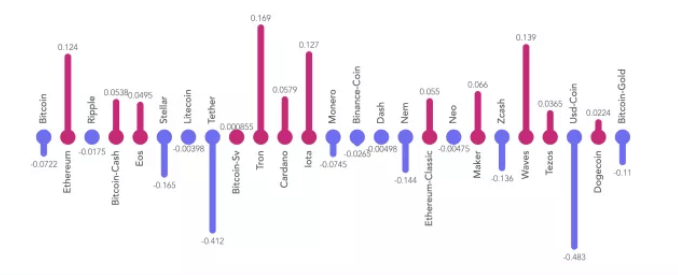
Ethereum and Iota generated Sharpe ratios of 0.124 and 0.127, respectively. TRON lead the way with a ratio of 0.169. Over the last month, Bitcoin had a dismal ratio of -0.0722, indicating that U.S. Treasury Bills outperformed the cryptocurrency in the last 30 days. These figures have little to no bearing on how the cryptocurrencies in question will perform in the following months.
Whether the Sharpe ratio has any relevance for evaluating the merits of a cryptocurrency is another matter entirely. The new asset class is new enough and volatile enough that the ratio may not provide any useful information—but we’ll let the analysts in our audience make the final decision.
This news is republished from another source. You can check the original article here
Be the first to comment