
- Bitcoin price reveals a massive bearish continuation pattern, hinting at a crash to $11,747.
- Ethereum price bounces temporarily, with bears eyeing a drop to $1,282 and lower.
- Ripple price undoes its bullish charm and reveals the possibility of further downside.
Bitcoin price leans toward a crash as bears win the power struggle. This development has shifted the market’s tide in favor of sellers, and will soon be reflected in Ethereum and Ripples’ prices.
Bitcoin price has more to drop
Bitcoin price has formed a bearish continuation pattern known as a bear flag. This technical formation forecasts a 42% downswing obtained by adding the flagpole’s height to the breakout point.
So far, BTC has tagged the upper trend line of the flag thrice and is currently on its way to retesting the lower trend line. Assuming Bitcoin price breaks out at $20,462, the theoretical forecast method reveals a target of $11,747.
BTC/USD 1-day chart
On the other hand, if the Bitcoin price produces a daily candlestick close above the July 20 swing high at $24,277, it will invalidate the bullish thesis.
Ethereum price ready for more retracement
Ethereum price missed the retest of the $1,700 hurdle on July 24 and retraced roughly 18% to where it currently trades. A minor throwback seems to be in place but the selling pressure is likely to knock ETH down to the range high at $1,282.
A breakdown of this barrier could spell trouble for holders as ETH might explore revisiting the $1,000 psychological level.
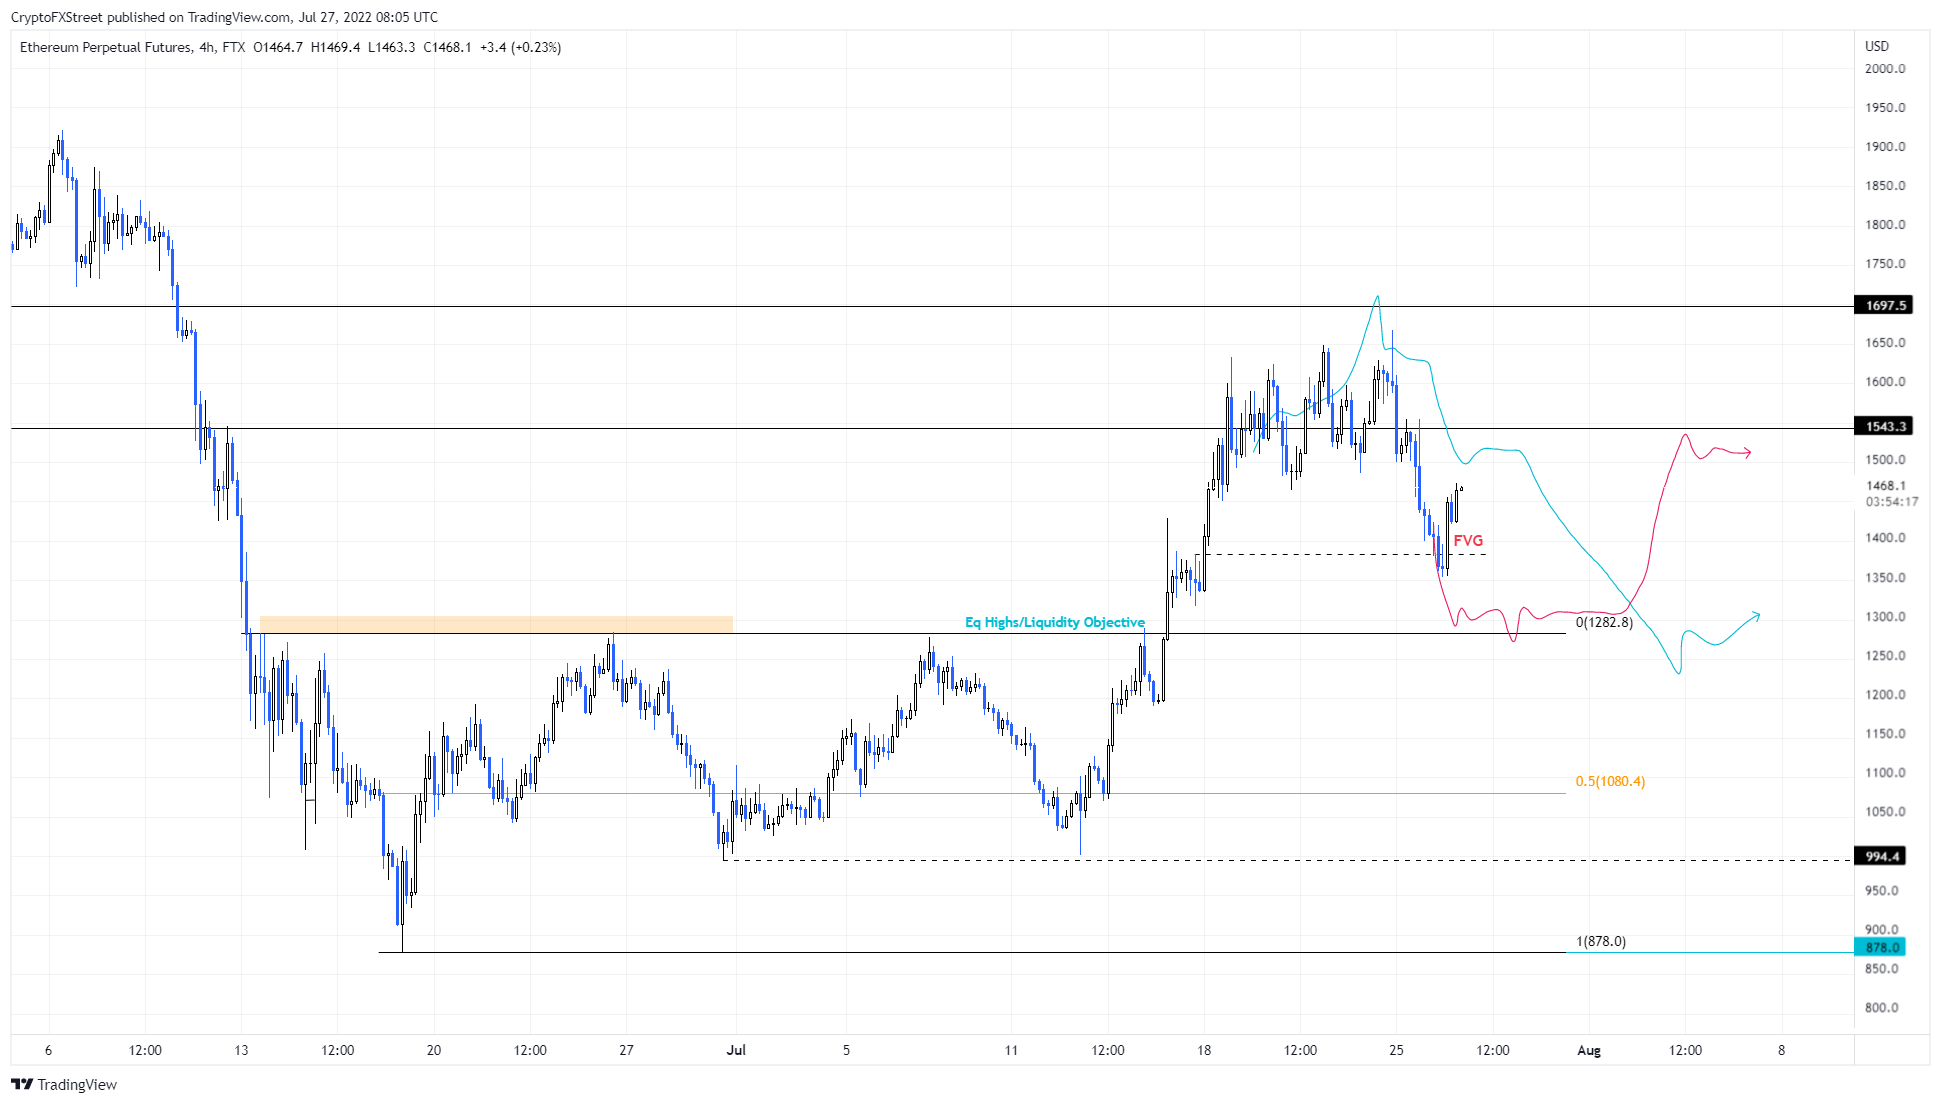
ETH/USD 4-hour chart
While things are looking pessimistic for Ethereum price, a daily candlestick close above the $1,543 hurdle will invalidate the bearish outlook. This development would provide buyers a chance to attempt another rally and potentially retest the $1,700 resistance barrier.
Ripple price loses hope
Ripple price is hovering below the $0.340 resistance barrier after a 14% retracement over the last six days. This downswing has also sliced through the two-month declining trend line that was flipped in the last week.
The overall outlook for Ripple is bearish as sellers could further drive the altcoin to the liquidity pool, extending from $0.301 to $0.311.
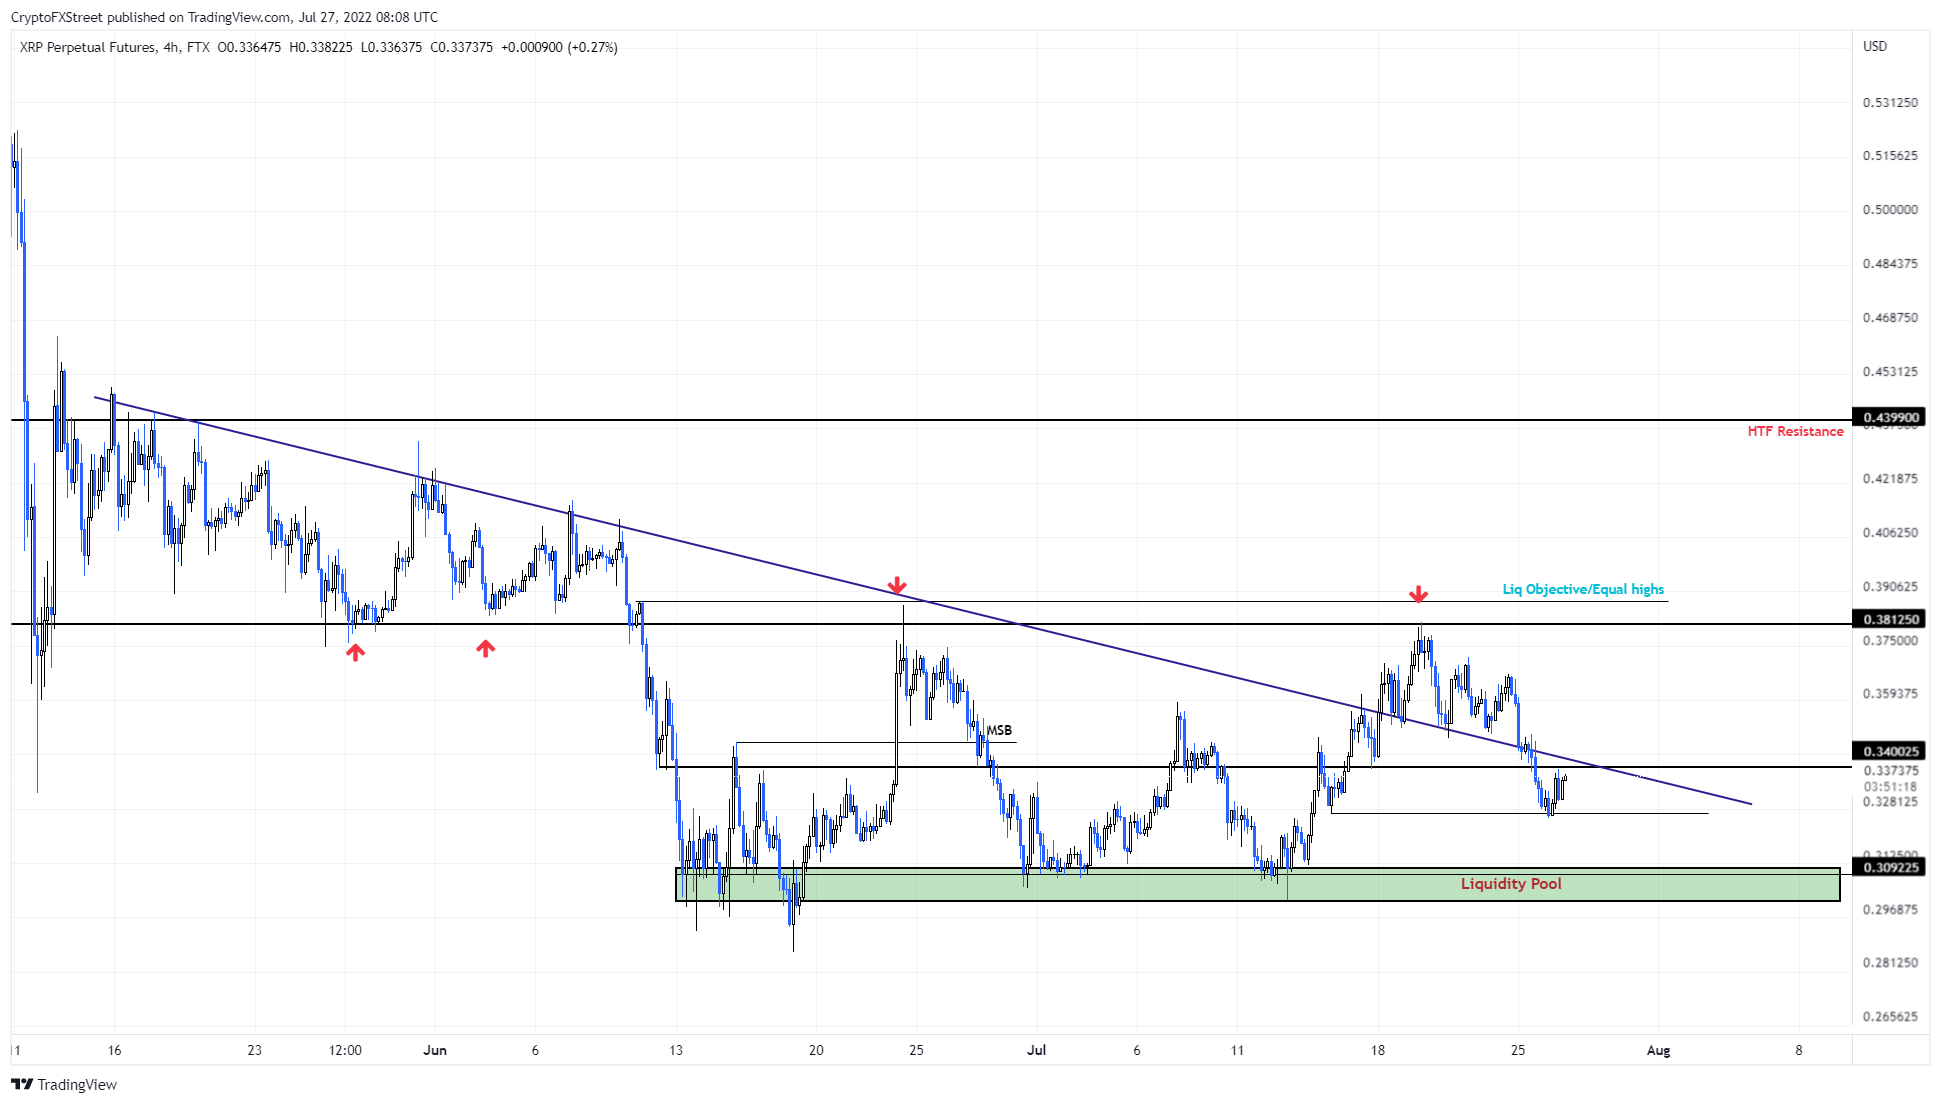
XRP/USD 1-day chart
Regardless of the bearish outlook, if XRP price flips the $0.340 hurdle into a support floor, investors can expect the possibility of a reversal. A confirmation will arrive if the remittance token manages to overcome the $0.381 hurdle.
This news is republished from another source. You can check the original article here
Be the first to comment