

MATIC propelled significantly over the last 24 hours driving price of the asset close to the dollar mark. It has followed the path of an upward trendline and soared substantially. MATIC has continued its bullish price trajectory since a week and the asset brought double-digit gains.
The altcoin has broken past several crucial resistance marks and now stands above the $0.77 support line. Pullback chances cannot be ruled out as the coin has been quite optimistic in the last week. Bitcoin recently touched the $22,000 level pushing major altcoins in the upward direction.
The altcoin’s bulls are now in control as the buyers have regained confidence in the coin. MATIC was overvalued at the time of writing. Technical outlook for the coin remained bullish on the four hour chart. The altcoin has continued to form higher highs which are an indication of bullish strength on the chart. If the bulls keep up the present price momentum, MATIC will soon revisit the dollar mark.
MATIC Price Analysis: Four Hour Chart
The altcoin was trading at $0.903 on the four hour chart. MATIC was very close to revisiting $1.00. If buyers keep up the momentum, MATIC will continue to soar upwards. Overhead resistance for the coin stood at $1.00.
In case of a pullback, the closest support level for MATIC was at $0.77, below which stood the $0.68 mark. The altcoin has maintained an upward trajectory (yellow line) painting bullish picture on the chart. Amount of MATIC traded increased over the last few days and that is indicative of mounting bullish strength.
Technical Analysis
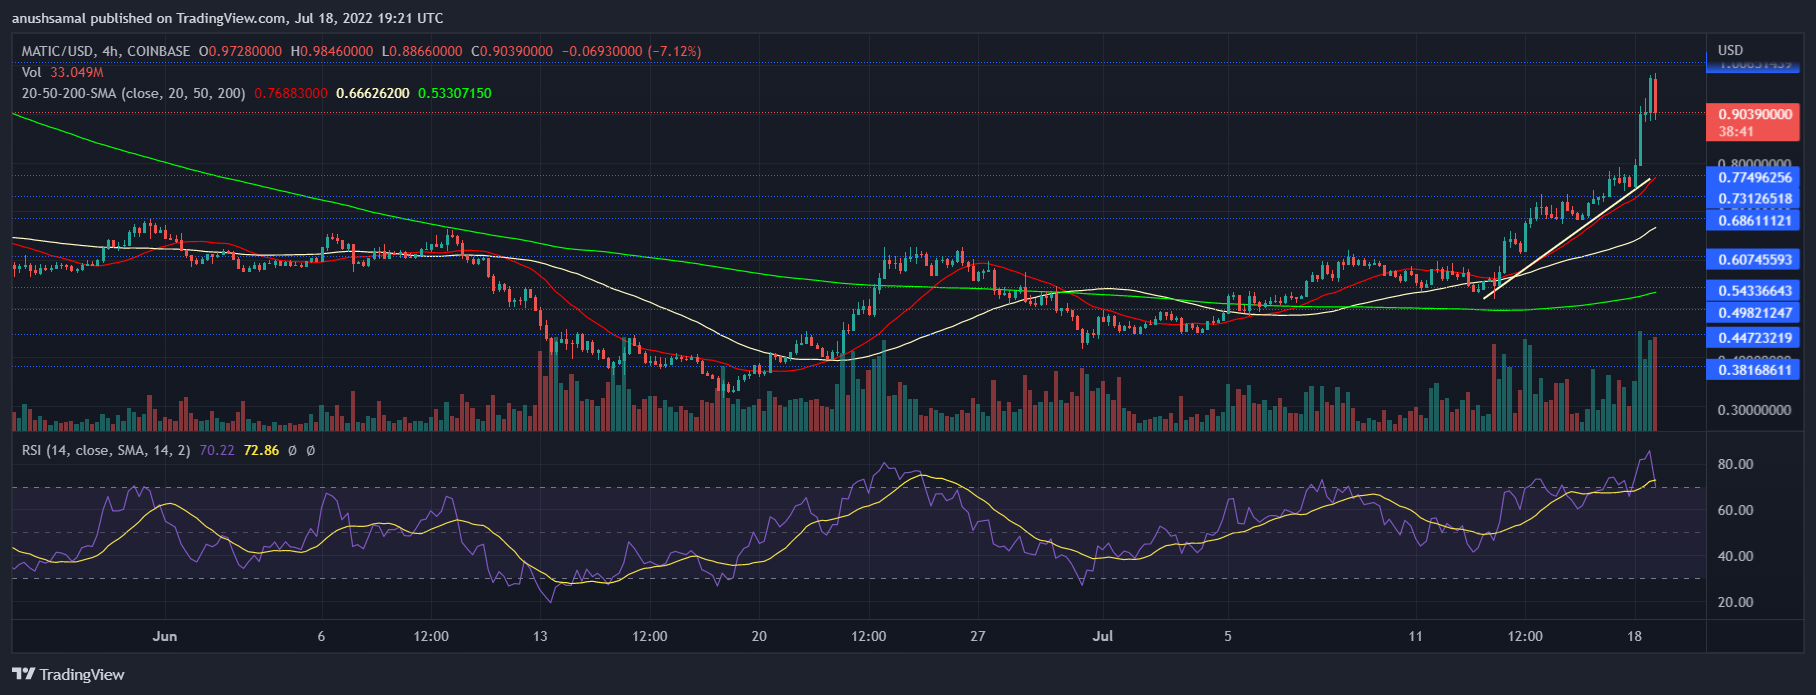
With increased buying momentum, the asset registered surplus buying strength. The indicators depicted the same on the four hour chart. The Relative Strength Index over the past few days have visited the overvalued zone.
At press time, RSI was in the overbought zone. Usually a pullback occurs when the asset visits the overbought zone. The price of MATIC was also way above the 20-SMA line which is suggestive of buyers driving the price momentum in the market.
Price above the 50-SMA and 200-SMA is considered to be sign of heavy bullishness.
Related Reading | Bitcoin Breaks Above Realized Price Again, Bottom Finally In?
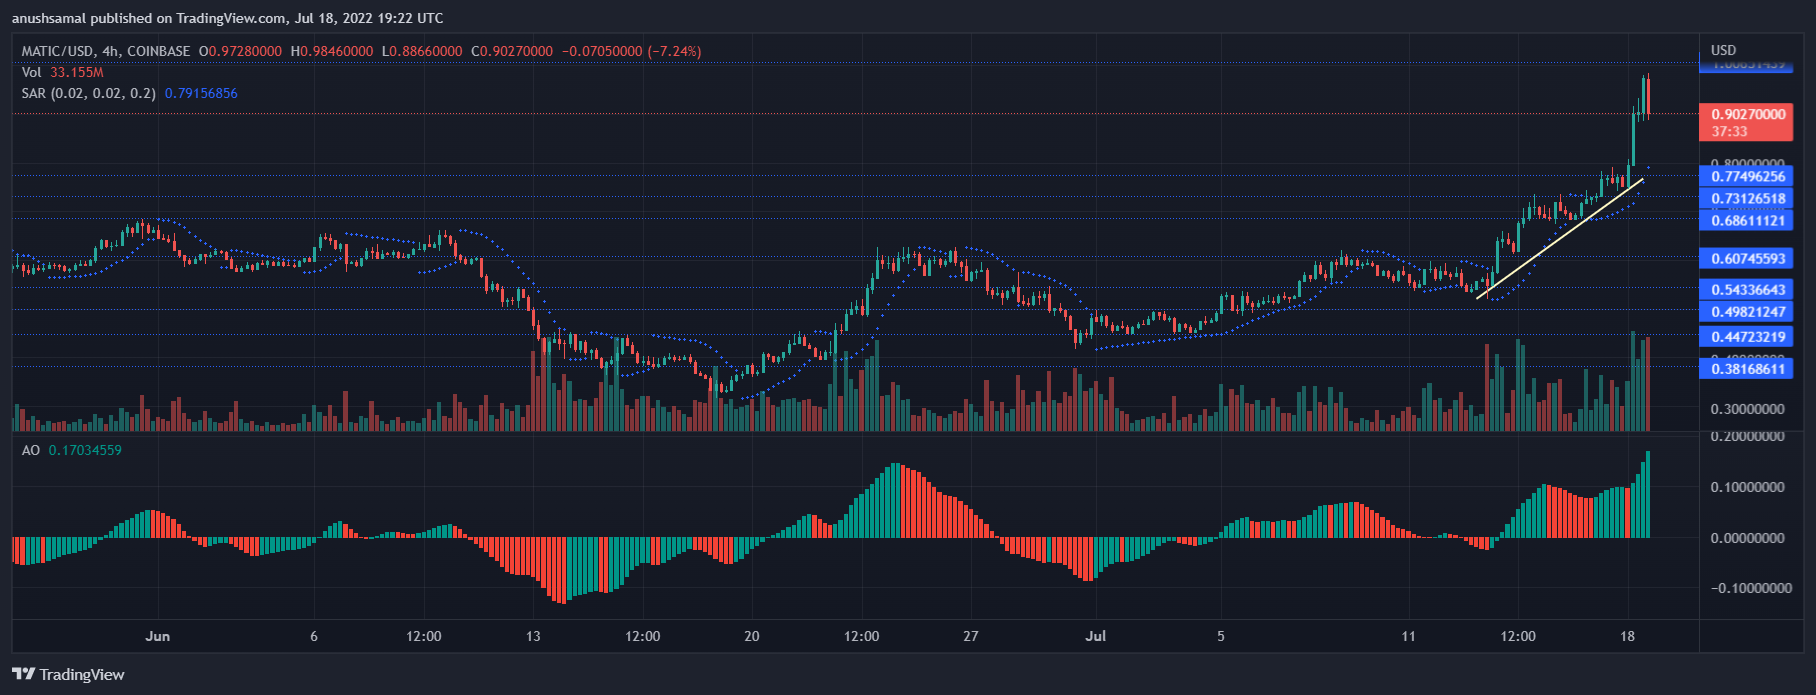
The altcoin flashed buy signals on the chart which the other indicators have taken into account. Awesome Oscillator indicates the price direction and changes in trends. AO pictured tall green signal bars as the coin turned green which were also buy signals.
Parabolic SAR depicts market momentum of a crypto, dots below the price always indicates upward price momentum. For MATIC to maintain the momentum, the coin has to cut through the $1.00 mark and maintain substantial buying strength. Broader market support also remains vital.
Related Reading | Liquidations Cross $230 Million As Ethereum Barrels Past $1,400
Featured image from Forbes.com, chart from TradingView.com
This news is republished from another source. You can check the original article here
Be the first to comment