

- Bitcoin price inches closer to a breakout from the falling wedge pattern.
- Ethereum price is retesting the upper trend line of the descending parallel channel, suggesting a breakout is around the corner.
- Ripple price is relatively less bullish, showing a lack of buying interest among investors.
Bitcoin price is exuding bullishness after the China FUD knocked it down. This optimism has helped Ethereum and other altcoins rally.
Ripple, however, is still stuck below a stiff barrier, unable to crossover.
Bitcoin price coils up
Bitcoin price has been sloping downward since the September 7 swing high at $52,956. Since then, BTC set up multiple lower highs and lower lows that converged as descent progressed. Connecting trend lines with these swing points reveals the formation of a falling wedge.
Although Bitcoin price has rallied over the past day or two, it has failed to retest the upper trend line. Assuming the buying pressure continues to rise, a breakout confirmation will arrive after BTC produces a decisive close above $44,893. In which case, Bitcoin price could likely continue climbing to retest $46,856 and its intended target at $49,725.
BTC/USDT 12-hour chart
On the other hand, if the BTC price fails to break out of the trend line, it will indicate weakness among the bulls. Such a development could give the sellers the upper hand, pushing it toward the 50% Fibonacci retracement level at $41,126.
However, a breakdown of $38,287 will create a lower low and invalidate the bullish thesis.
Ethereum price inches closer to a breakout
Unlike the big crypto, Ethereum price set up lower highs and lower lows that do not converge. Connecting the swing points formed since September 3 using trend lines results in a descending parallel channel.
So far, ETH has managed to scrape the upper trend line of this setup. A decisive close above $3,204 will confirm the start of a new uptrend. In such a situation, Ethereum price can rally 13% to tag the immediate resistance barrier at $3,619.
In a highly bullish case, Ethereum price might extend this ascent and retest the $3,952.
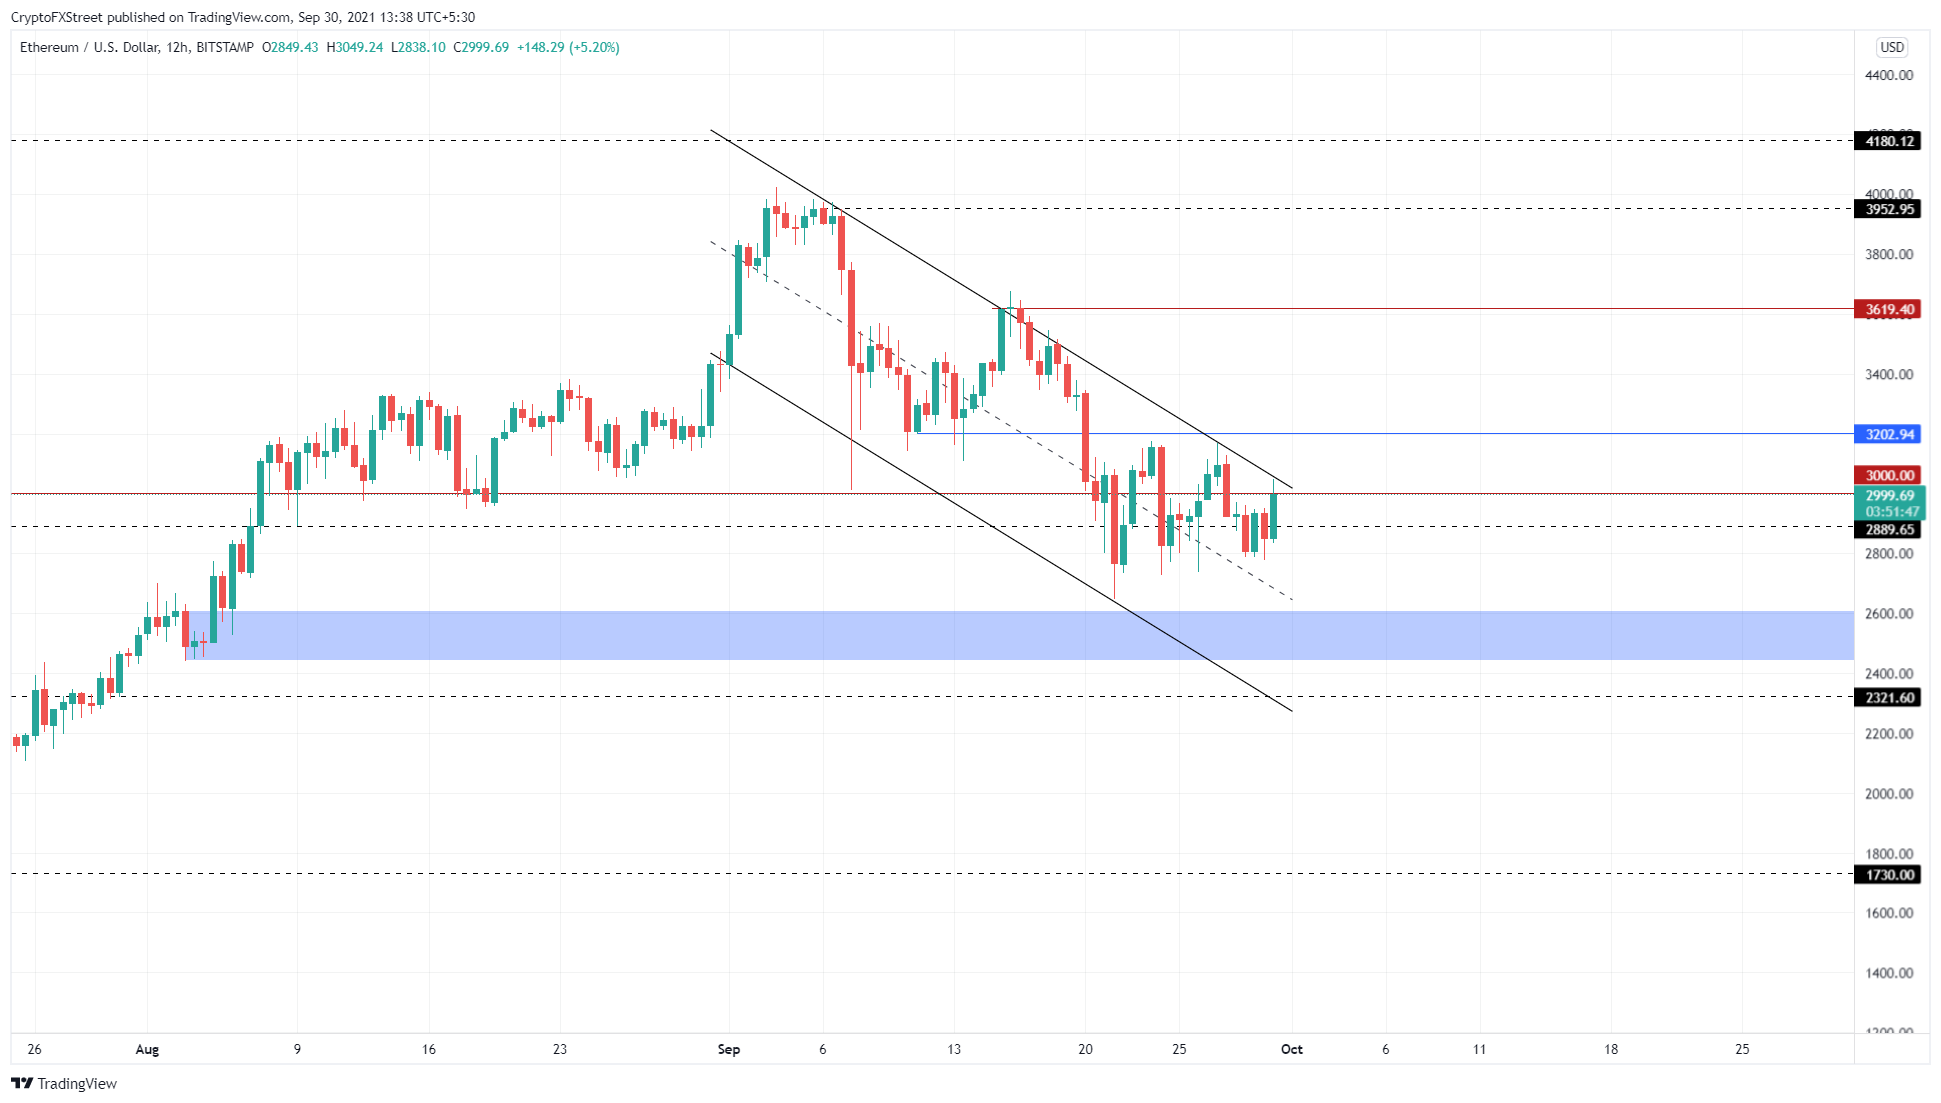
ETH/USDT 12-hour chart
While things seem to be going well for the smart contract token, a potential spike in selling pressure that knocks ETH down to the demand zone, ranging from $2,442 to $2,605, will be concerning as it would indicate weak buying pressure.
Although this would give the buyers another chance to restart the uptrend, a $2,442 support floor breakdown will invalidate the bullish thesis.
Ripple price consolidates, hoping for a move higher
Ripple price has been stuck below the support area ranging from $0.964 to $1.01. Although yesterday’s trading session pierced this zone, the buyers failed to maintain their bullish momentum.
As a result, the XRP price is currently hovering below $0.964, anticipating a surge in buying pressure.
A decisive close above $1.01 will create a higher high, inspiring confidence among the sidelined investors, allowing them to jump in. Such a development will propel Ripple price to slice through $1.09 and rally toward $1.267.
This ascent would constitute a 35% climb from the current position.
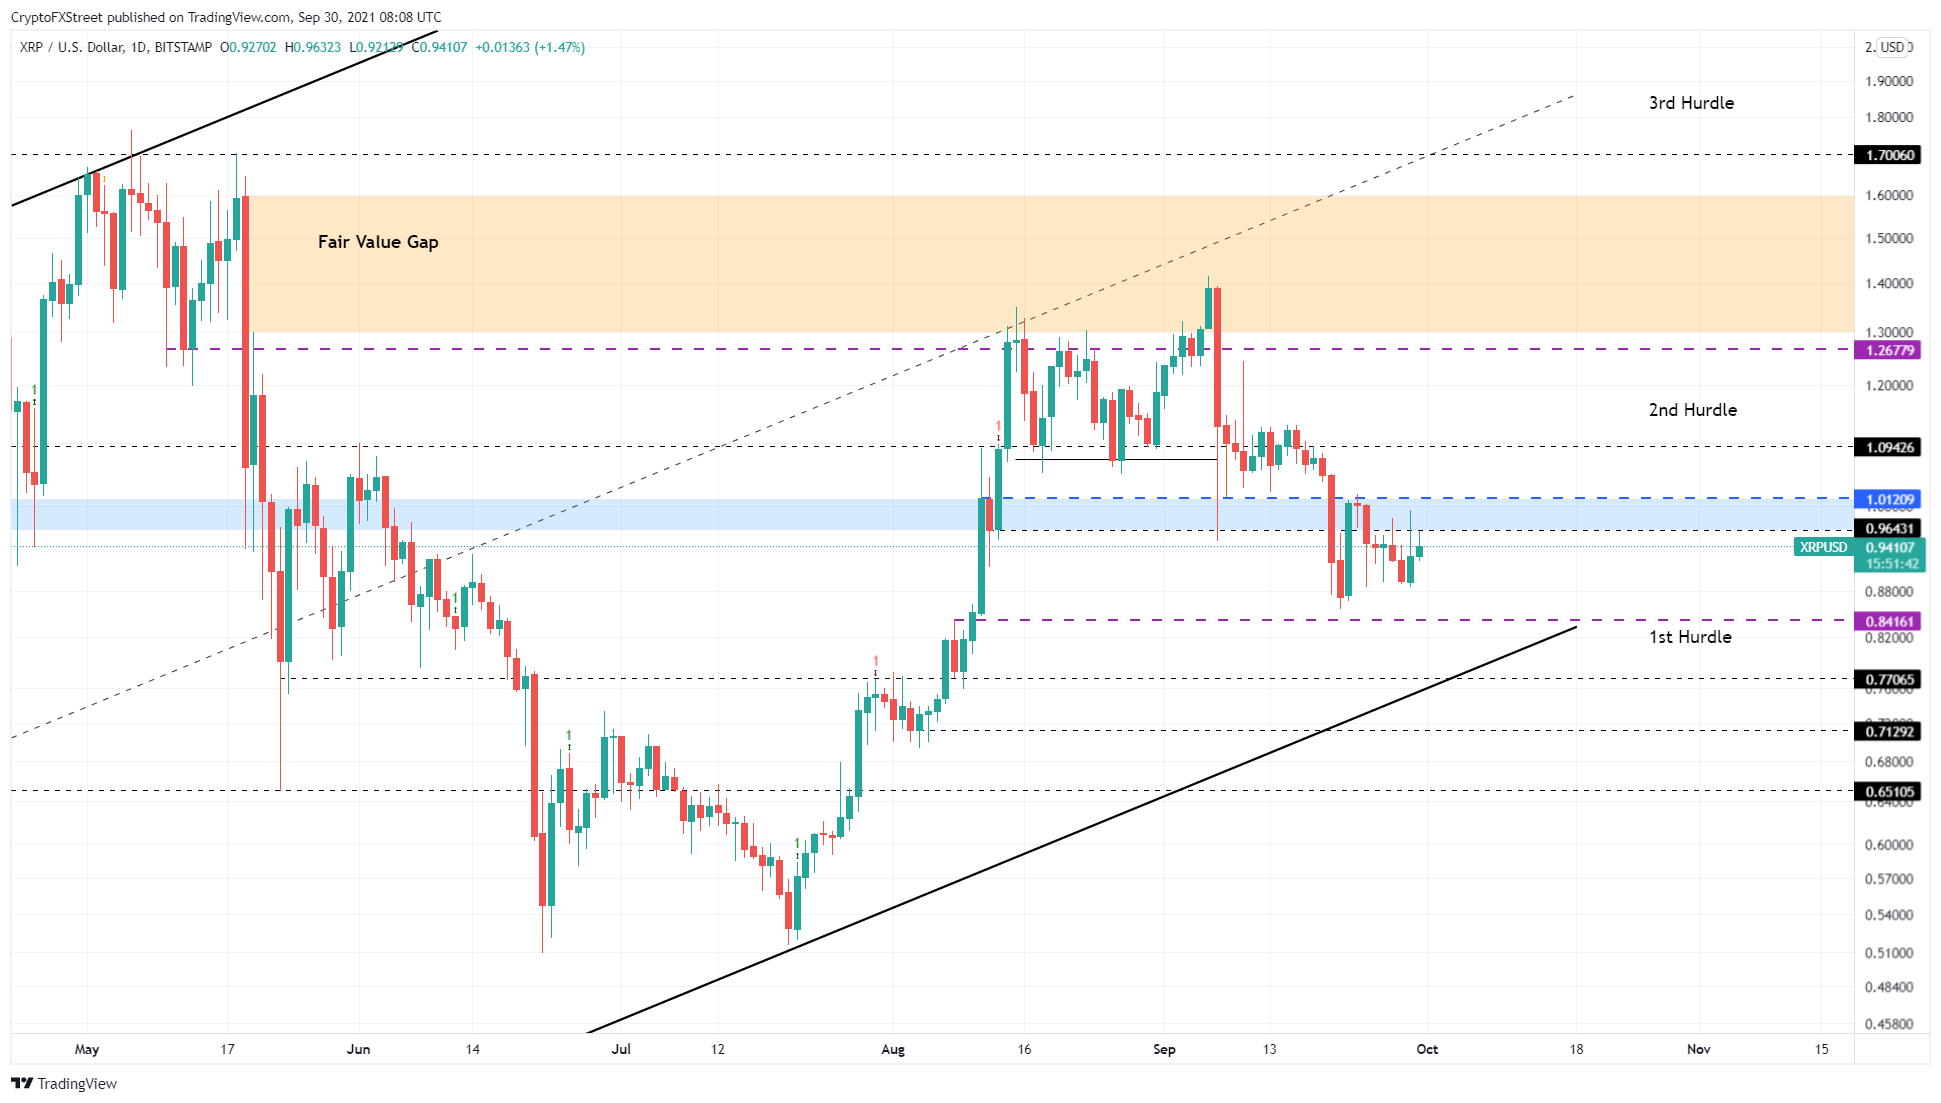
XRP/USDT 1-day chart
Regardless of the optimism, a decisive break above $1.01 is crucial for the bullish thesis mentioned above to come true. However, if the buyers fail to band together and get over the initial hurdle, it will likely result in a takeover from the bears.
A breakdown below $0.842 will invalidate the bullish thesis and potentially trigger a down move to $0.771.
This news is republished from another source. You can check the original article here
Be the first to comment