

- XRP price fell and closed below the 2021 Volume Point of Control, triggering intense selling pressure.
- While the overall technicals point to overwhelming bearish conditions, certain variables may indicate that a bear trap is developing.
- Trapping aggressive short-sellers could be the catalyst needed to rally XRP above the Cloud.
XRP price falling below the 2021 Volume Point of Control was the first significant sign that selling pressure was likely to take over during the Wednesday session. The pressure on the short side of the market was compounded when XRP and closed below both the Cloud and the bull flag. The road to lower prices is clear, but XRP could easily trap short-sellers if it closes above some key levels.
XRP price drops over 10% on Wednesday but has rallied as much as 8% during the Thursday trade session
XRP price has returned inside the Cloud on the daily Ichimoku chart, creating unfavorable conditions for trading. It is difficult to determine a bias when an instrument is inside the Cloud because the Cloud represents uncertainty and volatility. Point and Figure charts clean up the ‘noise’ on Japanese candlestick charts and provide a clearer-cut view of where entries can occur and the appropriate reward for risk.
XRP/USD Daily Ichimomku Chart
On the short side of the trade, the hypothetical trade setup is an entry at $0.94, a stop loss at $1.02, and a profit target at $0.62. The profit target is determined by the vertical profit target method in Point and Figure analysis. $0.62 may be too ambitious of a profit target and not entirely realistic, so a two-box or three-box trailing stop would help protect any potential profit made on the short side.
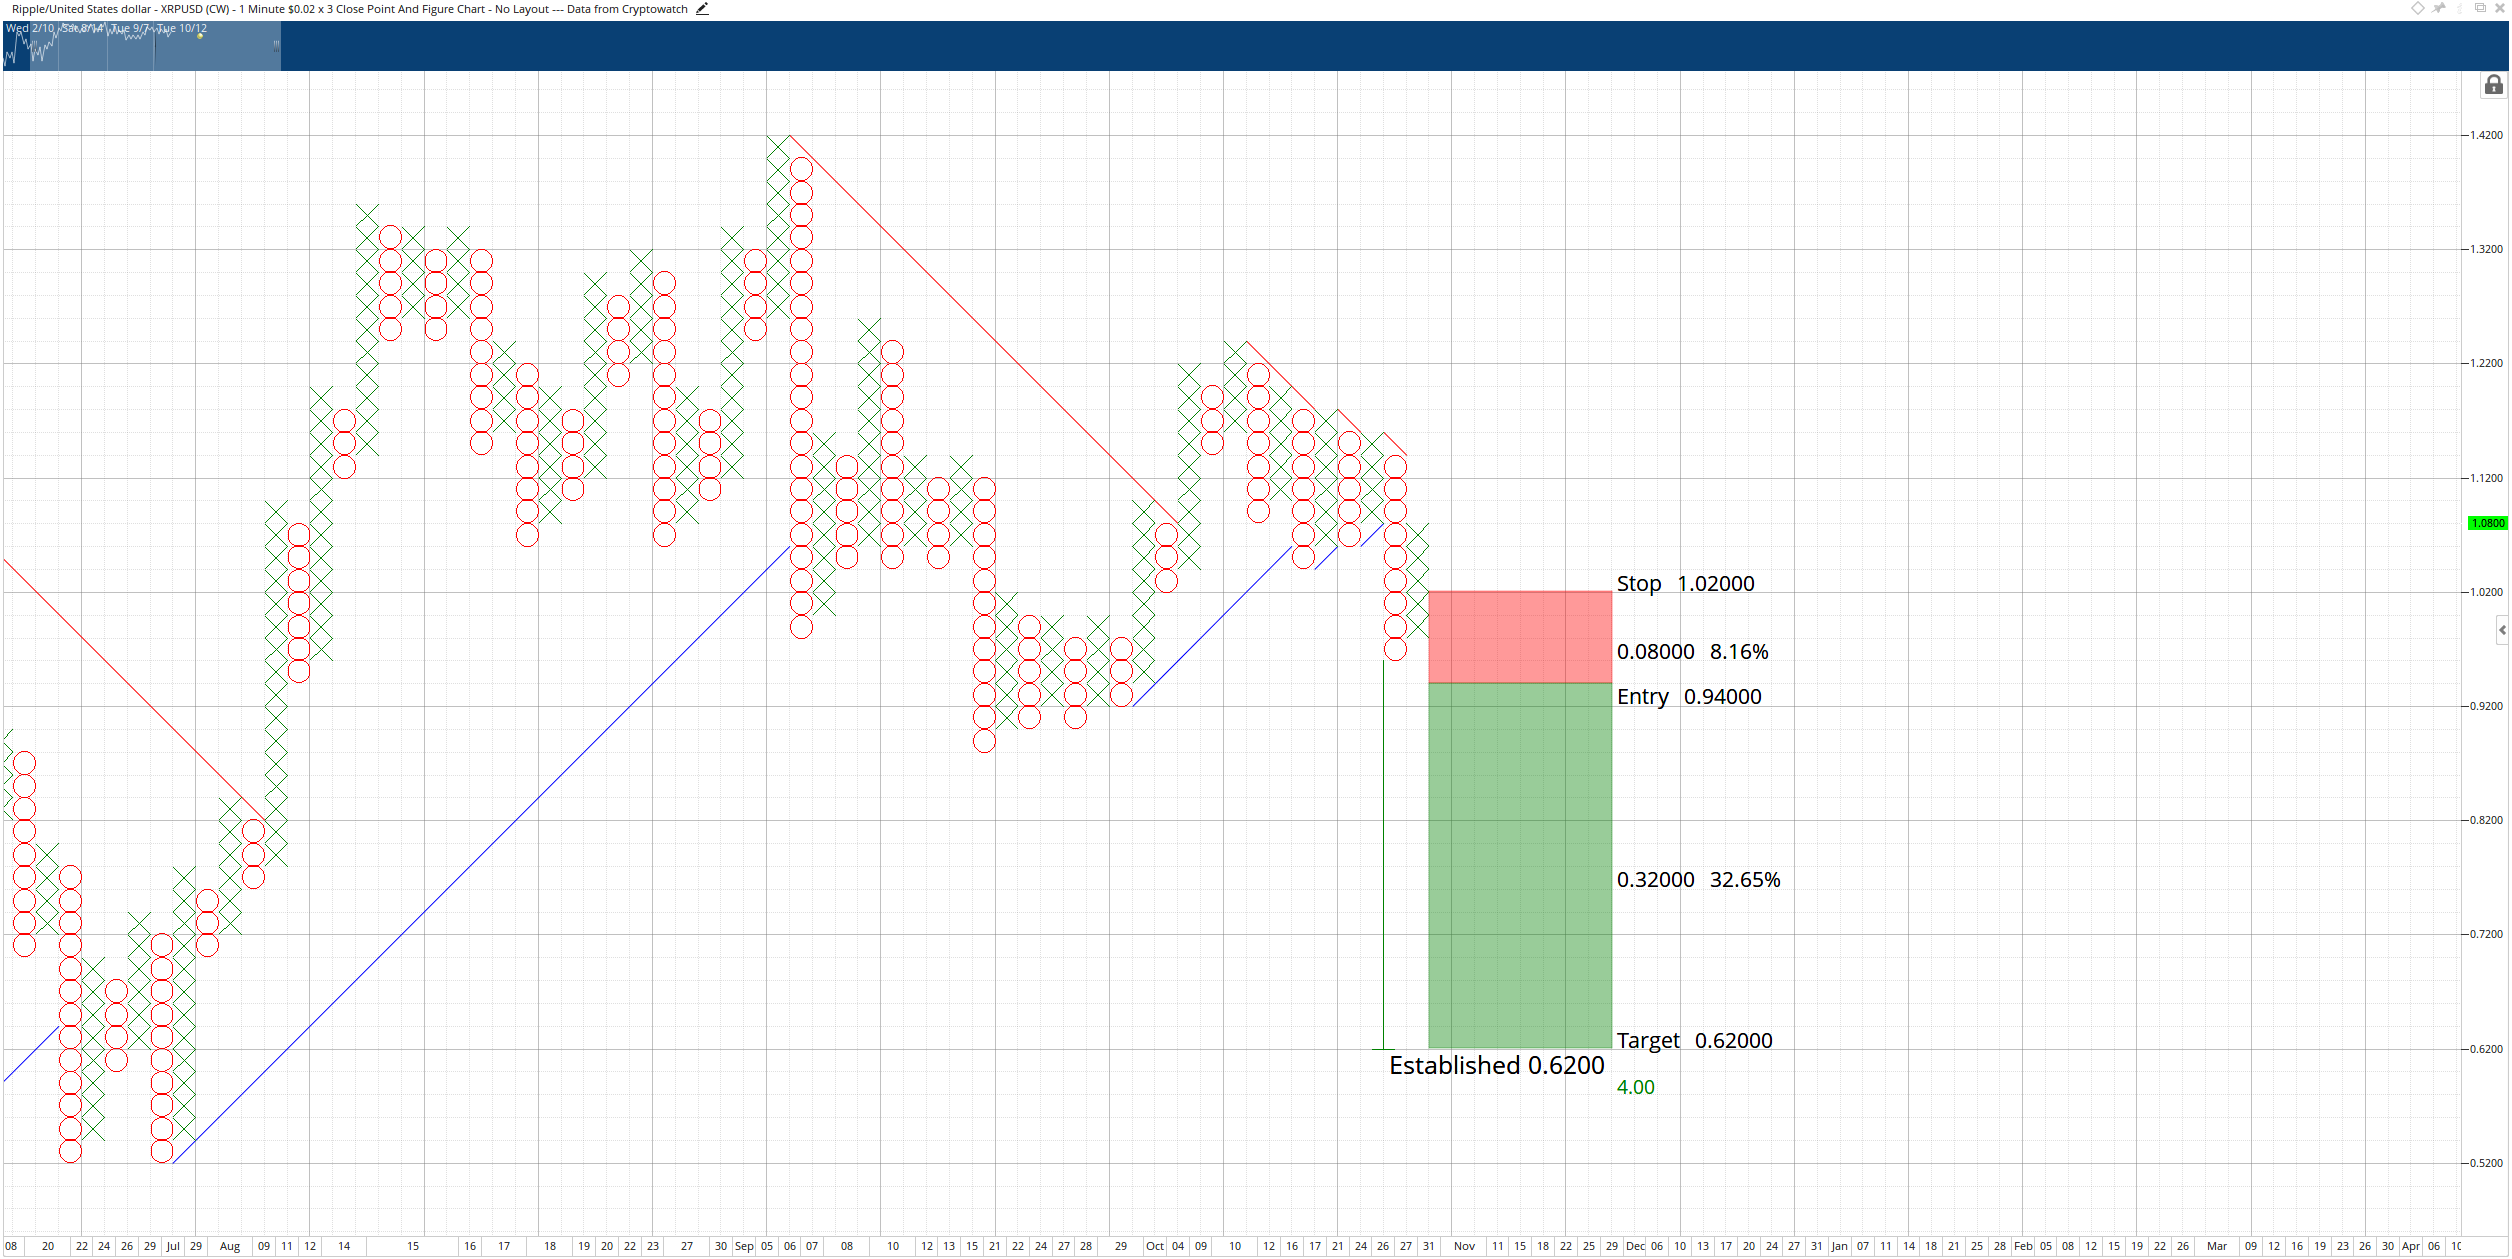
XRP/USD $0.02/3-box Reversal Point and Figure Chart
The hypothetical short trade idea is invalidated if XRP price returns to $1.12.
On the long side of the trade, the hypothetical trade setup is a buy limit/buy stop at $1.06, a stop loss at $0.98 and a profit target of $1.50. The entry is based on the 50% retracement from the Point and Figure pattern known as a Pole Pattern. The profit target of $1.50 is based on a high volume node in the volume profile and the expected momentum break that would occur if XRP price can crack above the neckline of the inverse head and shoulders pattern.
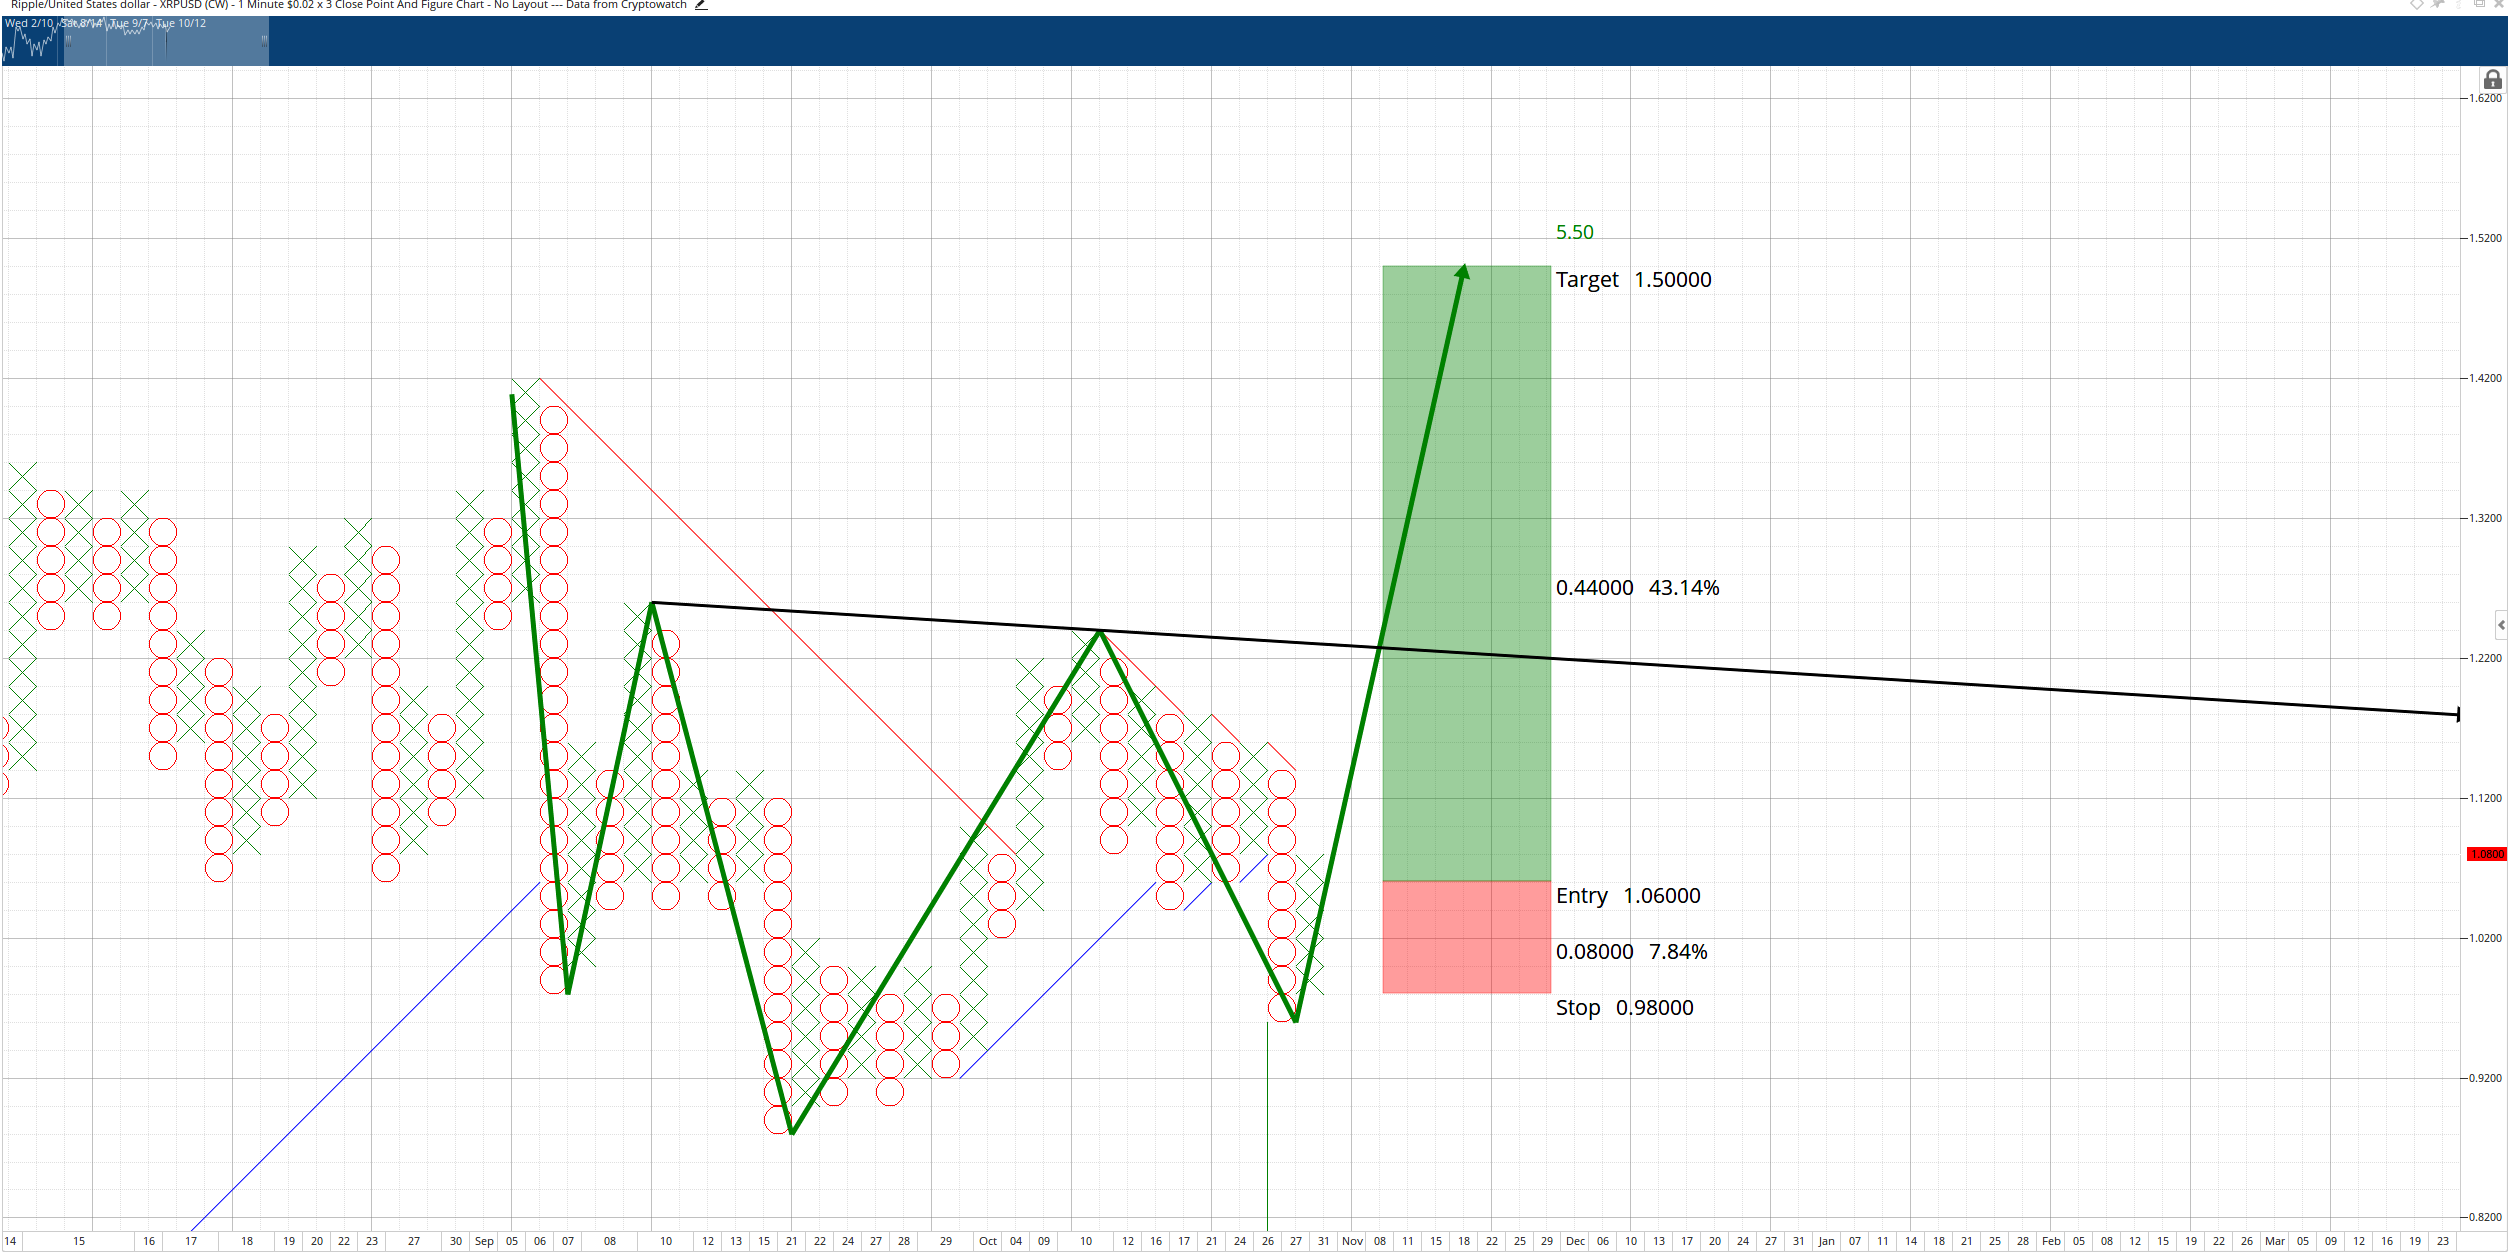
XRP/USD $0.02/3-box Reversal Point and Figure Chart
The hypothetical long trade is invalidated if a new O-column develops and moves below $0.94.
This news is republished from another source. You can check the original article here
Be the first to comment